

Monitoring and managing system performance is a challenge and handling it in a SaaS environment is made more challenging as we don’t have access to the supporting hardware. Thankfully there are three features in Business Central for performance monitoring. This is part one of a three-part dive into Business Central performance monitoring.
In this discussion we will review Azure Application Insights, how to configure it, and what performance telemetry is available. We will wrap this up with some Power BI reporting to expose the data from Application Insights and digest it to actionable items.
The first step is setting up Application Insights. Application Insights is an Azure Service designed to collect telemetry data about web servers and we page performance. To create an Application Insights system, you will need an Azure Subscription, a pay-as-you go is a great option for this service.
Log into your Azure Management Page at portal.azure.com and click “Create a resource”.

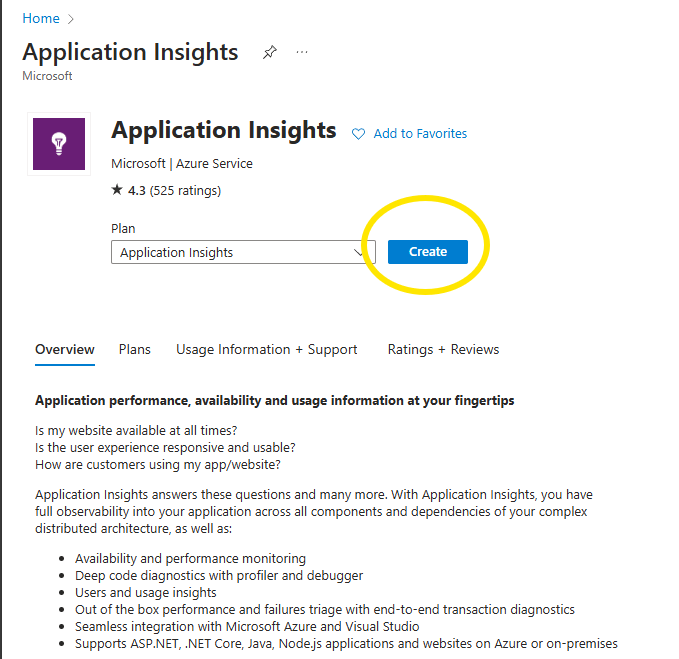
We then search for the Application Insights service.

Click the Application Insights button.

Then click “Create”
On the next page we setup the service.
- Select your Subscription
- Select a Resource Group, or Click “Create new” and provide a Resource Group Name
- Leave the rest Default
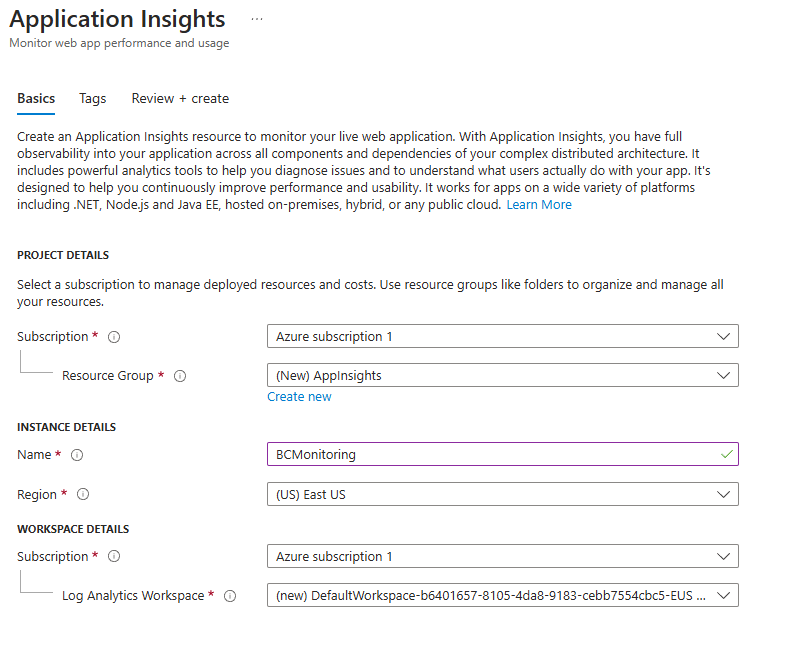

There is a “Review + Create” button on the bottom of the page, click it.
Last click the “Create” button. There will be a few minutes of plugging and chugging, be patient. When complete, the notifications bell should show you this:
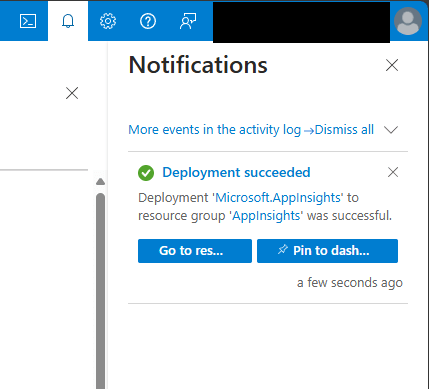
Click the “Go To Resources” button.
Behold! Application Insights.
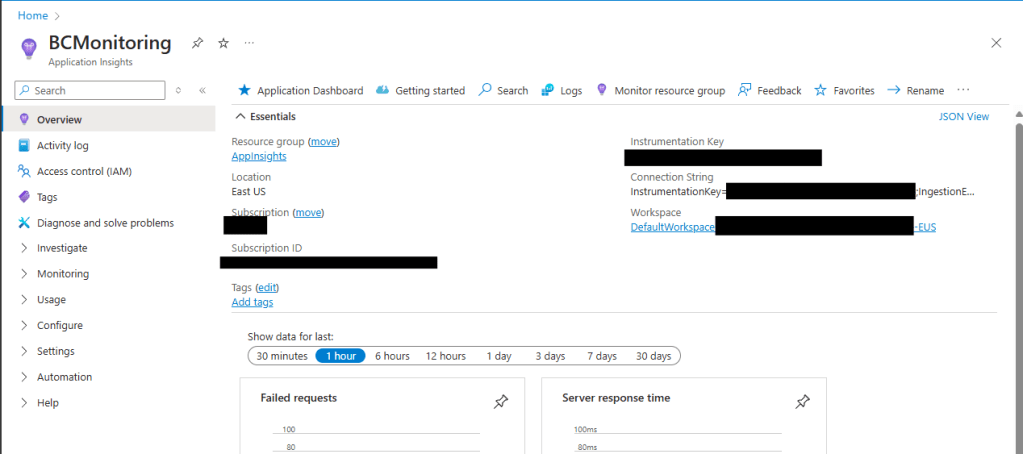
Don’t mind the redactions, you can’t be too careful.
How do we connect this with Business Central?
Log into your Business Central Admin page and select the Environment you wish to monitor.
Click on the “Define” link in the Telemetry section.

Copy the Connection String from the Application Insights page, it is the second value on the right column from our previous screenshot. Paste it into the Azure Application Insights Connection String field.
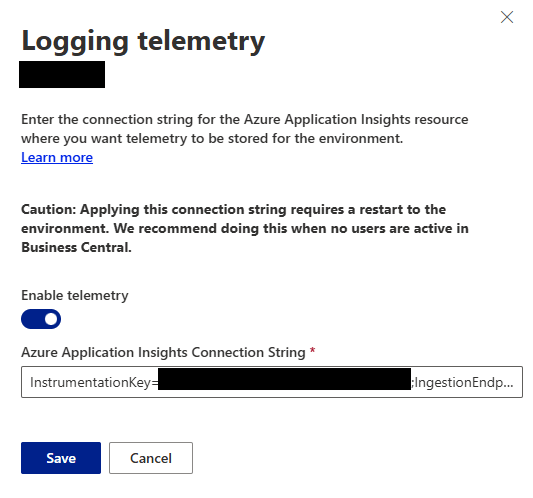
Click “Save”.
We are done! The Business Central system is now logging telemetry data to Application Insights. It will take a little while for there to be anything interesting in the logs.
Bookmark this page and come back later when the system has collected data for us to review. I’ll wait.
Welcome Back! I hope you had a good few days.
We are returning to the Application Insights instance we created earlier and navigating to the Monitoring > Logs page.

The astute among you may have noticed the name of the Application Insights instance has changed, I created this one earlier to collect some data for me.
There are several categories of data that are available for Application Insights, Business Central utilizes a select sub-set:
- browserTimings
- pageViews
- traces
Simply double clicking on one of those topics will add it to the query window. Click “Run” to retrieve the last 24 hours of data.

So, we now have a lot of data, and a kind of ugly grid to view it in. If only there was a super easy way to get this data into Power BI for analysis.
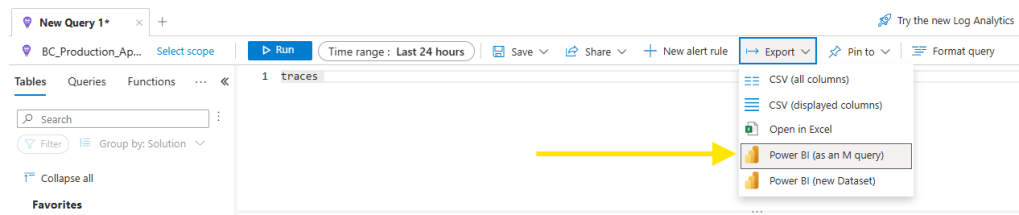
This button spits out a file that looks like this:
/*
The exported Power Query Formula Language (M Language ) can be used with Power Query in Excel
and Power BI Desktop.
For Power BI Desktop follow the instructions below:
1) Download Power BI Desktop from https://powerbi.microsoft.com/desktop/
2) In Power BI Desktop select: 'Get Data' -> 'Blank Query'->'Advanced Query Editor'
3) Paste the M Language script into the Advanced Query Editor and select 'Done'
*/


let AnalyticsQuery =
let Source = Json.Document(Web.Contents("https://api.applicationinsights.io/v1/apps/<your connection GUID>/query",
[Query=[#"query"="traces
",#"x-ms-app"="AAPBI",#"timespan"="P1D",#"prefer"="ai.response-thinning=true"],Timeout=#duration(0,0,4,0)])),
TypeMap = #table(
{ "AnalyticsTypes", "Type" },
{
{ "string",   Text.Type },
{ "int",      Int32.Type },
{ "long",     Int64.Type },
{ "real",     Double.Type },
{ "timespan", Duration.Type },
{ "datetime", DateTimeZone.Type },
{ "bool",     Logical.Type },
{ "guid",     Text.Type },
{ "dynamic",  Text.Type }
}),
DataTable = Source[tables]{0},
Columns = Table.FromRecords(DataTable[columns]),
ColumnsWithType = Table.Join(Columns, {"type"}, TypeMap , {"AnalyticsTypes"}),
Rows = Table.FromRows(DataTable[rows], Columns[name]),
Table = Table.TransformColumnTypes(Rows, Table.ToList(ColumnsWithType, (c) => { c{0}, c{3}}))
in
Table
in AnalyticsQuery
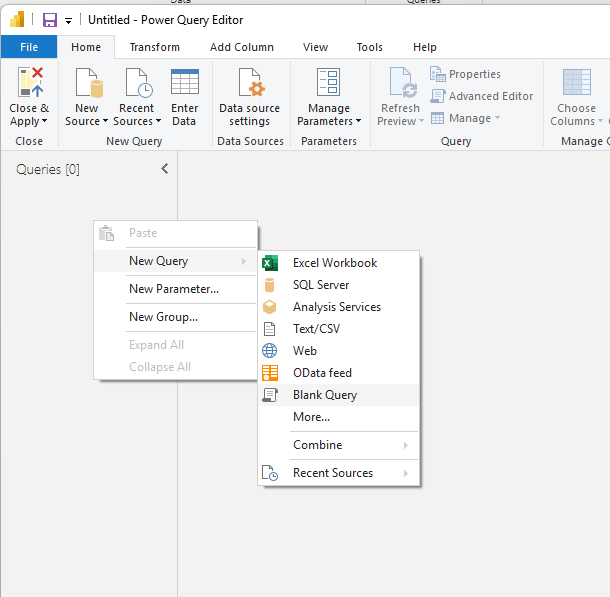
The file includes Power BI Instructions. Let’s start up Power BI Desktop.
On a Blank Report, transform data window, I’m going to create a blank query.
Then I’m going to open that query with the Advanced Editor
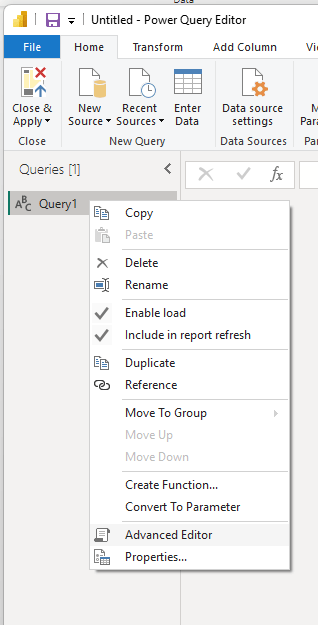
Then I’m going to paste in the query I downloaded from Application Insights.

Then click “Done”.
You will need to login with credentials that have access to that Application Insights instance.
Click “Edit Credentials” and select “Organizational account”, then login.
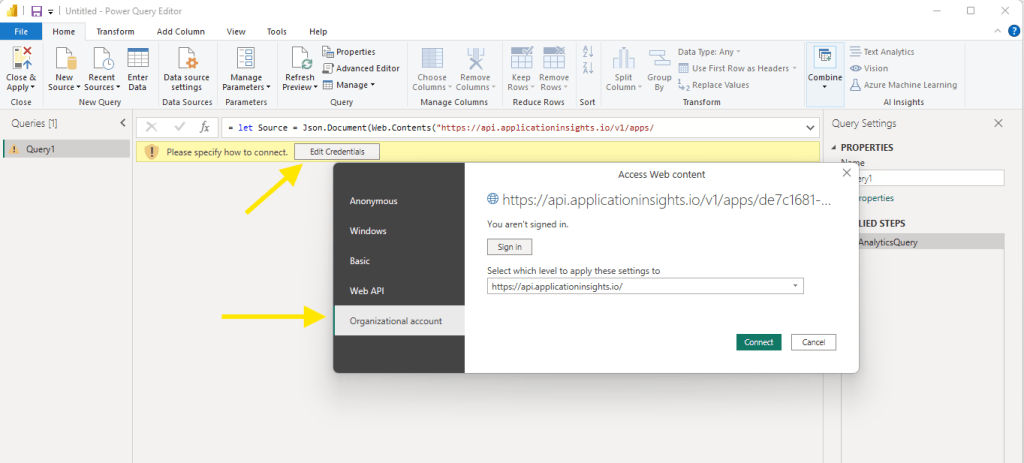
Then click “Connect”.
This is the Traces query, so I will rename the query from Query1 to Traces to keep things clear.
There are a few important fields to identify here. The Session_ID and User_ID are great for tracing issues. They are what appears when the user goes into the help screen.
The Message and customDimensions are the really important fields for issue analysis. The customDimensions field is actually a JSON string with a lot of important data in it.
Right click on the customDimensions header and transform it to JSON.

You can then click on the Expand Table button to break out all the fields.
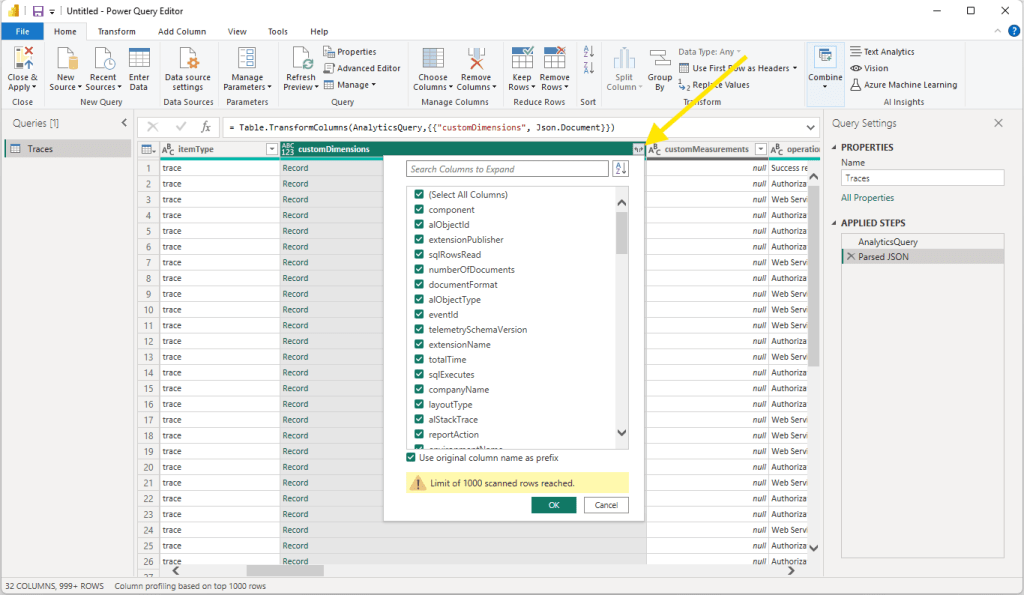
This will expand out the table and let you review all the data points it provides. Here you can find errors reported, execution times, blocking SQL events, and login permissions errors amongst many other data points. Reviewing this data for execution times in excess of 3 seconds can help find bottle necks that are impacting your user’s experience.
I’m going to repeat the process as Traces, with pageViews. Clear the query in the Application Insights Log. Double click on “pageViews” in the Application Insights log viewer, then download the M Query.
This log shows us a lot of details about the page viewing experience. Critical to our analysis, the page name and the duration of the page load experience. There is also a convenient performance bucket breakdown so that you can prioritize slow loading pages.
There are additional details like web browser version and geographic location of the user. Knowing that all users on a specific browser or in a location are having a similar performance issue can be an excellent tool.
Like the Traces query, there is a customDimensions JSON field that can be converted to JSON and expanded. This provides additional details like what fast tabs were open, screen resolution, was the fact box expanded and if the page is part of the Business Central base or an extension.
We can repeat the process one more time with the browserTimings log. This log is much like pageViews, but a bit deeper. The major feature here is that it splits the page load duration into 4 parts and a total.
Let’s break down what these mean with a picture
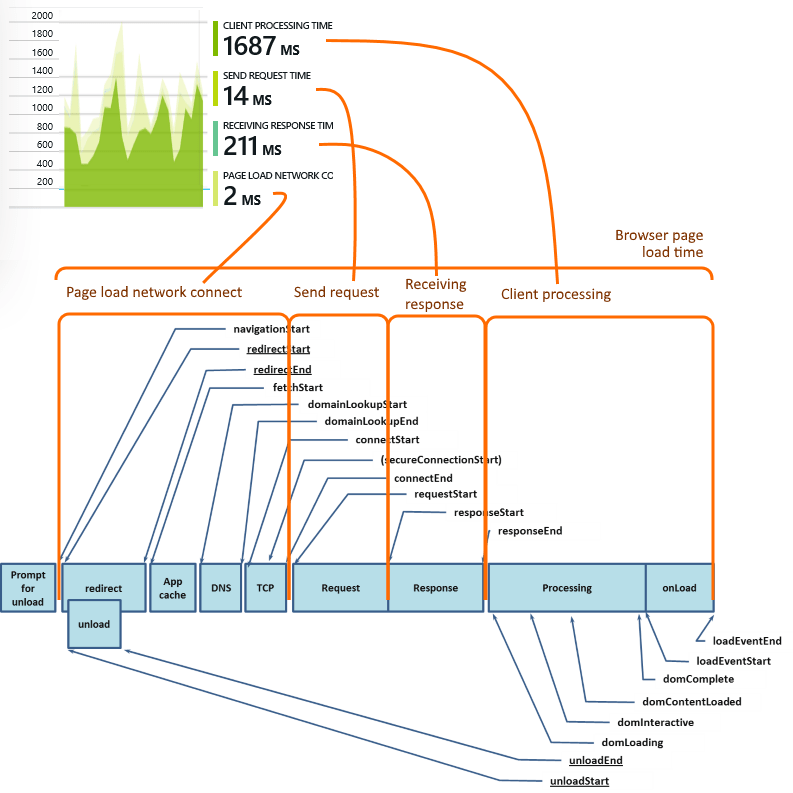
Network Duration: The time it takes for the browser to connect to the web page. If this number is high, the computer may be having an issue on the local network, or there is an issue between the network and the Azure hosting of Business Central. This is the low-level computers connecting to computers phase.
Send Duration: This is the time, after the computer has connected to the server, for the request to be sent. Retrieving records this should be very fast; on saving of a record this could be slower.
Receive Duration: The amount of time it takes to receive the data from the server. This can become slow if there is a lot of data, graphics, and other elements on the page.
Processing Duration: This is the bulk of the time spend on a page. This is the time to render the page, display all the elements, perform any page scripts, the basic DOM load tasks. If this starts taking too long, you may consider reducing the number of elements on the page. Creating task specific pages can greatly reduce the Processing duration.
Processing duration can also be impacted by other browser tasks that are running. Having a lot of tabs open, having streaming music running in one of those tabs, and the scrolling news page in another tab, all these tabs are consuming browser resources and consuming the available page processing resources. When I’m debugging a slow page issue, I always ask for a screen shot including all open tabs.
More information available here: Application Insights – Metric Explorer – Part 1 – Azure DevOps Blog (microsoft.com)
If you have followed along to this point, you have your Application Insight Telemetry configured and a Power BI dataset ready for you to layout in whichever way is best for you. There is a lot you can discover about the innerworkings of Business Central through the telemetry data.
An important note! Application Insights is not free. There is a monthly amount of data ingestion that is included at no cost, but there are cases where Business Central performs poorly and logs a lot of data. In these cases, Application Insights can run a charge of a few dollars per month. There are extensions that have the option to log a lot of data to the Business Central Telemetry system, I’m speaking from experience here, resulting in thousands of dollars of Application Insights ingestion charges. Set a spending limit or alerts to prevent overages.
I hope you enjoy your new ability to analysis Business Central performance. As you develop extensions, this data becomes hugely valuable in creating well-functioning processes and pages.


Leave a comment