

Monitoring and managing system performance is a challenge and handling it in a SaaS environment is made more challenging as we don’t have access to the supporting hardware. Thankfully there are three features in Business Central for performance monitoring. This is part two of a three-part dive into Business Central performance monitoring.
In this discussion we will review Business Central Performance Profiler and what performance telemetry is available.
The Performance Profiler, also known as the in-client performance profiler, is quite a bit different from the Application Insights approach we implemented last week. In this paradigm, we turn on the profiler, do the thing that results in low performance and then review the results. This is a much more targeted and strategic approach.
As an added bonus, the Performance Profiler works in a Docker Instance. Running in Docker makes it very useful for validating the performance of customizations that are being developed in a Docker instance of Business Central.
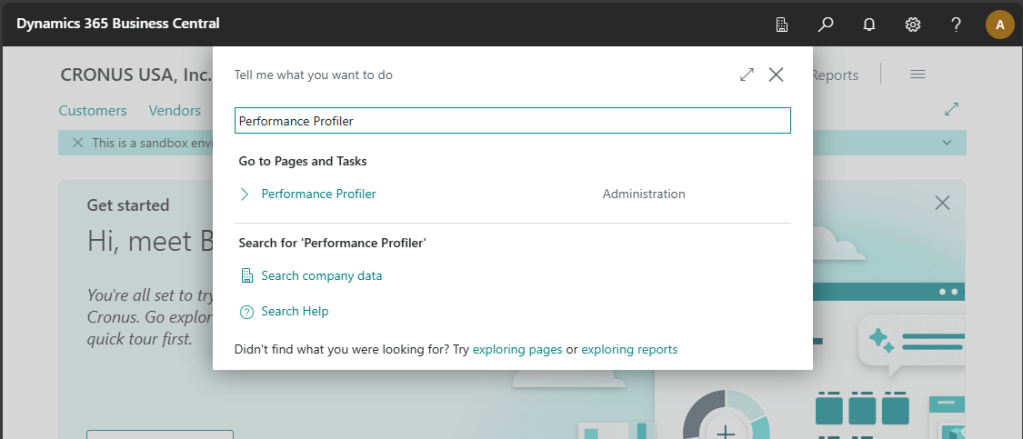
First must open the Performance Profiler. Click the Magnifying Glass in the upper right corner of Business Central and type “Performance Profiler”.
Click the Open in New Window button to pop the profiler out into a new window. This makes it easier to start and stop the profiler.
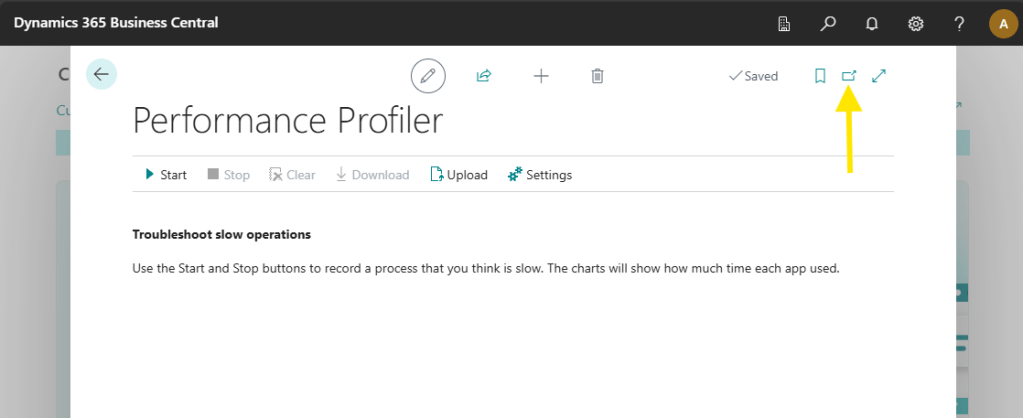
Press the Start button and recreate the action that you wish to profile. For this example, I’m running the Quote, Invoice, Post process that we have been developing as a part of the Business Central Journey Series.
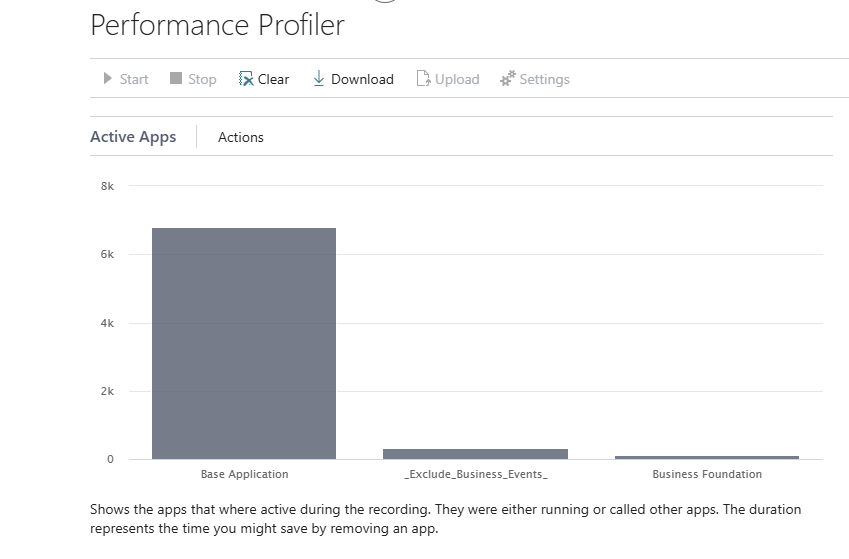
Once complete I click the Stop button, and immediately I have some results.
The first graph shows what Apps were active and how much time they consumed in milliseconds.
There is a slider to “Show technical information”. Click that to display additional graphs.

Here is a pie chart of the time in relationship to the entire run time.
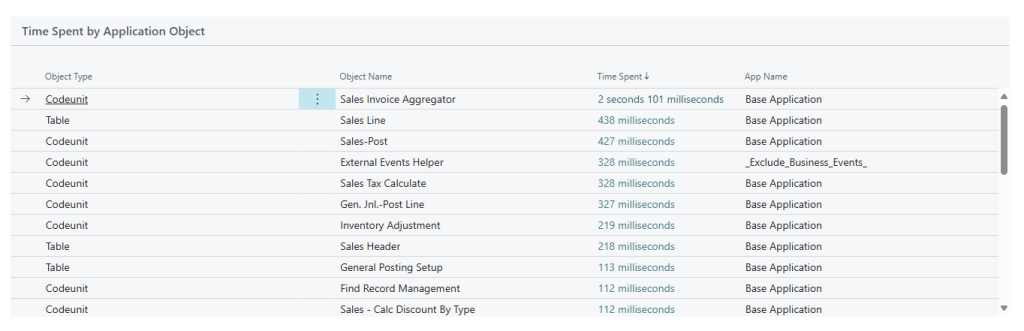
The table of time spent by Application Object shows us each object and the amount of time it takes to execute the task.
Last, we have the Call Tree. This shows the execution time for each procedure that was called. The procedures are nested in order of operation.

There is a Download button which will download these results as a text file. You can Upload them back into the Performance Profiler later if you wish to review the data from a previous run.
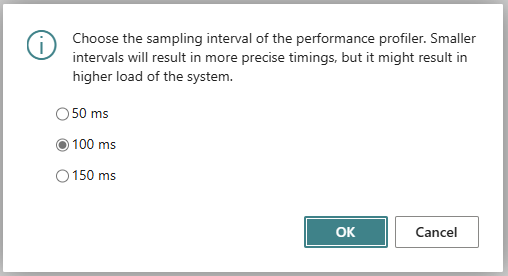
The settings button allows for the adjustment of the sampling rate. Faster rates will get better timing results but will place the system under a higher load. This can be useful when fine tuning performance, but not great if you are tracking an issue on an already stressed system.
More details can be found here: Performance Profiler overview – Business Central | Microsoft Learn
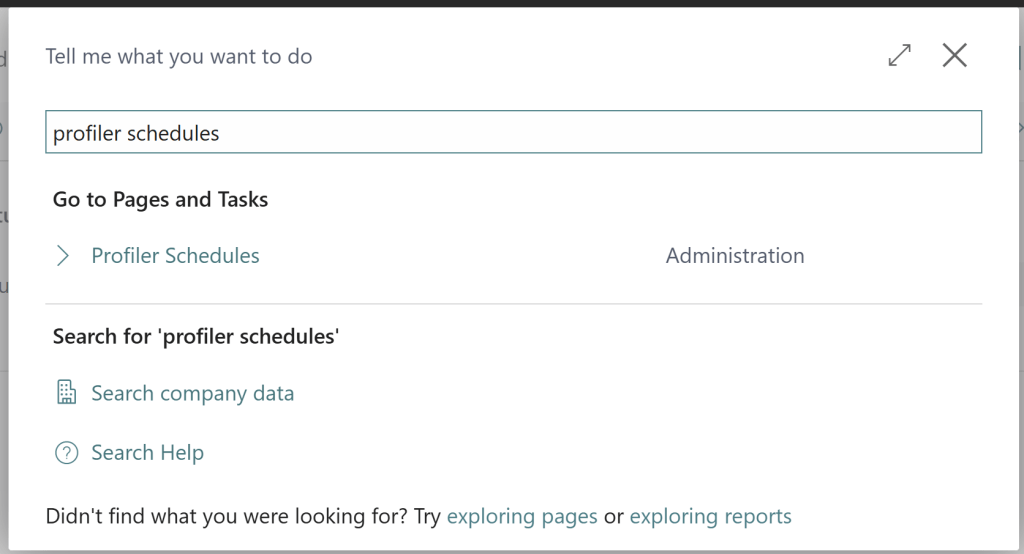
Not all issues happen when you are available to start and stop a profile. For these more elusive issues, there is a Profiler Schedule. Using the schedule, you can configure a profile to start and stop capturing data for future analysis. Click on the Business Central Magnifying glass and enter “Profiler Schedules”
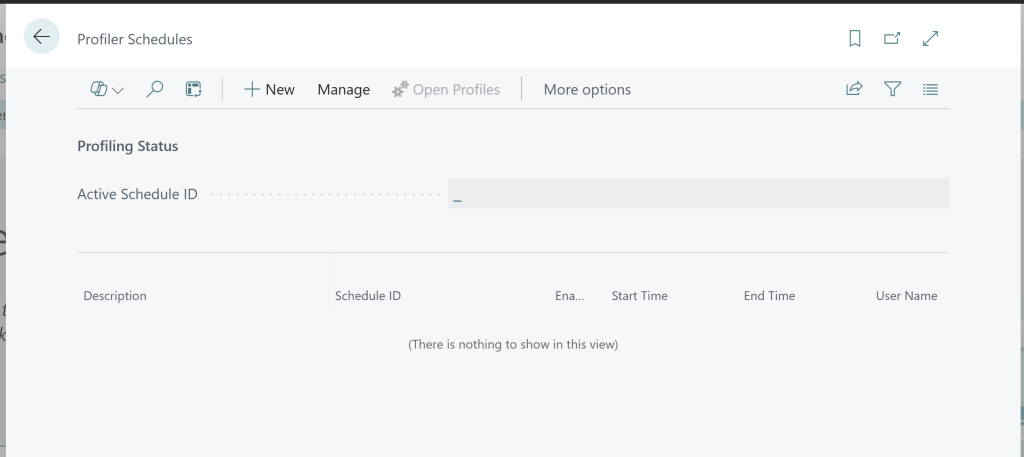
From this card page you can create scheduled profilers to monitor for specific events in Business Central. You start by clicking the “+ New” button.
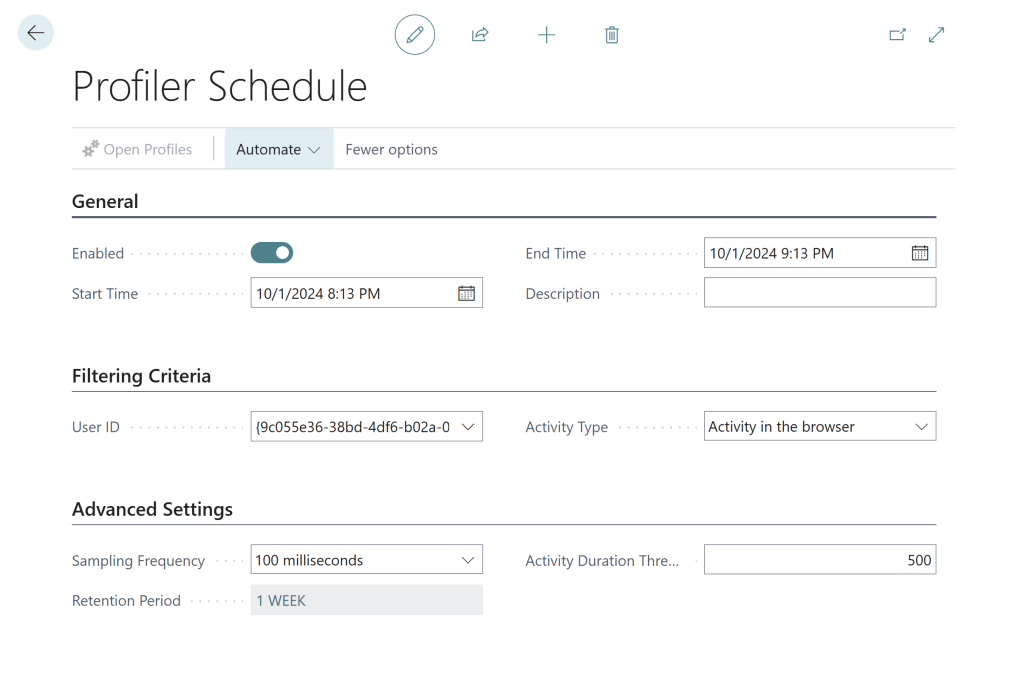
Here we can give it a description, which user id to monitor, what activity type, and the sampling frequency. The Activity Duration Threshold sets a minimum amount of time an activity must be active before it logs the data, this helps restrict the data capture to a reasonable size and focus on slower activities.
Returning later, the Open Profiles button will allow you to review the stored profiles and analyze the results.
Scheduled performance profiler overview – Business Central | Microsoft Learn
While hunting for that process that is slowing down your Business Central is never fun, I hope that the Performance Profiler helps you track down the issue.


Leave a comment