

Monitoring and managing system performance is a challenge and handling it in a SaaS environment is made more challenging as we don’t have access to the supporting hardware. Thankfully there are three features in Business Central for performance monitoring. This is part three of a three-part dive into Business Central performance monitoring.
We have previously discussed using Application Insights and the Performance Profiler tools to analyze the performance of Business Central. As extension developers, we have tools that we can utilize to analyze performance during the development cycle. This can help us find issues and improve performance before deploying to the end users.
Using Visual Studio Code, we can execute our customization and generate a profile at the same time. We need to make a change to your Launch.JSON file in order to enable the profiling process.
{
    "version": "0.2.0",
    "configurations": [
        {
            "name": "snapshotInitialize: Your own server",
            "type": "al",
            "request": "snapshotInitialize",
            "sessionId": 158,
            "environmentType": "OnPrem",
            "server": "http://aardvarklabs",
            "tenant": "default",
            "serverInstance": "BC",
            "authentication": "UserPassword",
            "breakOnNext": "WebClient",
            "executionContext": "DebugAndProfile",
            "profilingType": "Instrumentation"
        }
    ]
}
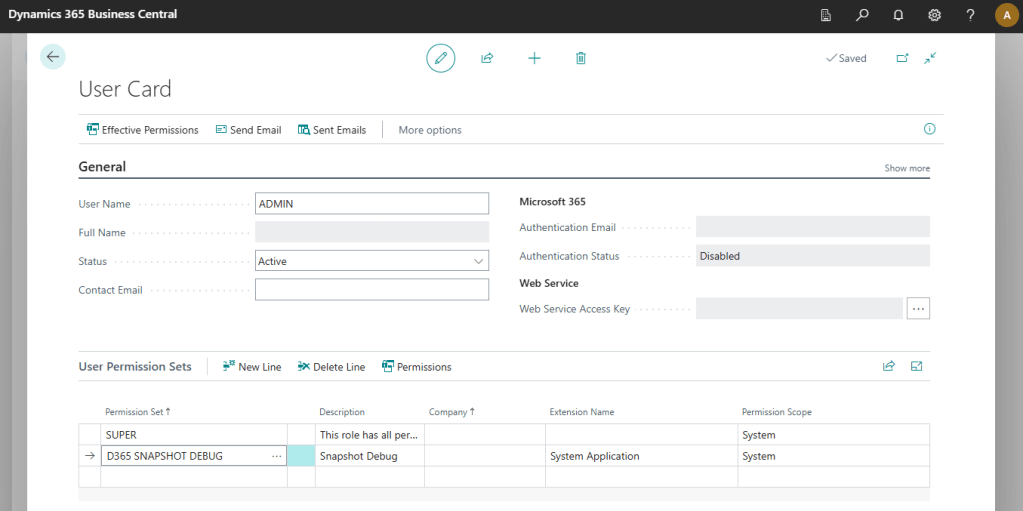
I need to provide a session id, which I got from Business Central by clicking on the ? for Help, then clicking “Help & Support” then finding my Session ID (Server) value.

I also gave my user the D365 Snapshot Debug permission set.
Okay, back to Visual Studio Code.
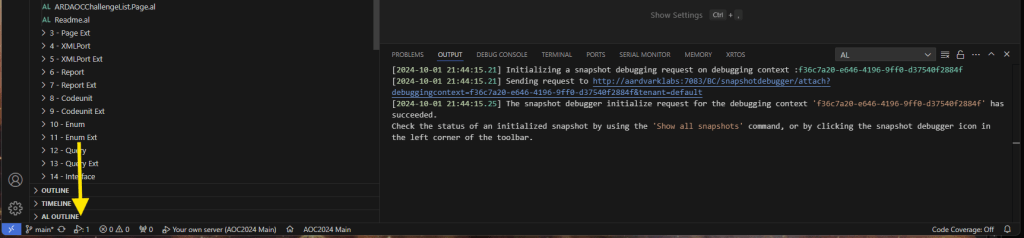
Press F7 or CRTL SHIFT P and type “AL: Initialize Snapshot Debugging”

The Output terminal should display text about initializing the request and the debug counter should show a “1”.
You can now utilize Business Central and generate performance data.
For this example, I’m going to poke around the system, then attempt to send an email. My Docker is not configured to send emails, so this will generate an error.

Back to Visual Studio Code.
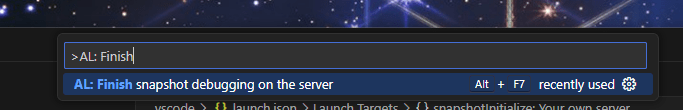
Press ALT F7 or CRTL SHIFT P and type “AL: Finish Snapshot Debugging on the server”
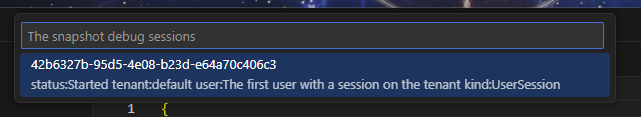
There is a popup listing the snapshots that are active. Click on the one you wish to finalize.
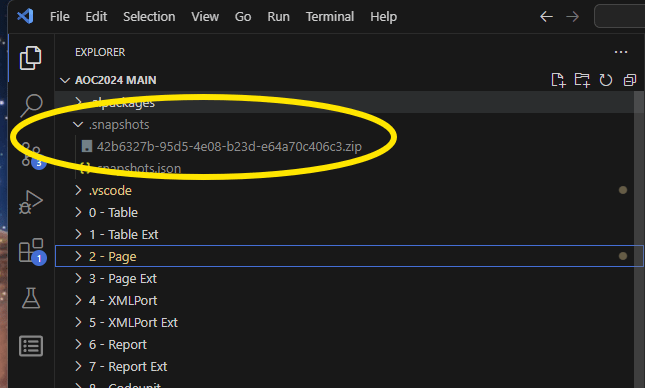
Your .snapshots folder should now contain a file.
Clicking on the Snapshot debugging button, then selecting the desired snapshot will run that snapshot in Visual Studio Code.

We can now see that Visual Studio Code breaks at the point where we generated the error.

This is already really great for working on resolving issues. We can run this process, perform a series of complex action, and play them back for review.
While snapshot playback is interesting and something we may lok at deeper; what we are looking for is the Performance Data. To generate the performance data, we need to run a command. Press CRTL SHIFT P and type “AL: Generate profile file” then choose the snapshot you wish to profile.
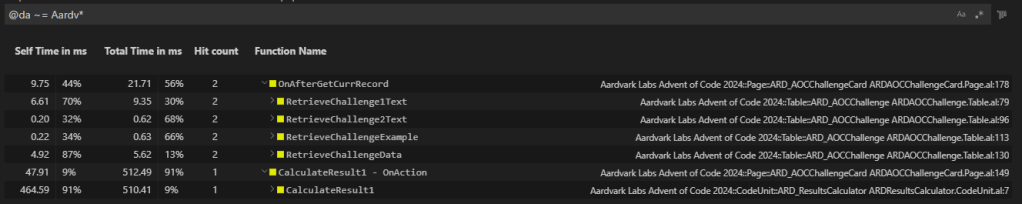
This generates a table of functions and the statistics about their execution time.

There is a wealth of information available here. One thing to note is the color coded squares. These indicate the source of the function.
| Layer | Color |
| System Application | Green |
| Base Application | Magenta |
| Other Extension | Yellow |
| System | Blue |
| Custom | Named extension, defaults to “extension” if not found |
If the colors aren’t right for you, in my case the Yellow and Green are rather similar (my color-blind peeps know what I’m talking about), you can change them in the al.profilerColors property in the AL Language Extension Configuration.
There is a filter expression bar where you can filter down the results to help find problem functions. If I want to find functions where the execution time was greater than 500ms I would use the expression “@t > 500”

Another example is finding all the nodes with a name that starts with Aard, for my Aardvark Labs Extension. This filter is “@da ~= Aardv*”
Clicking on the functions on the right most column will bring you directly to the code for those functions. This is amazingly powerful when you find a slow function, you can navigate directly to the offending code.
There are more features and filter descriptors here AL Profiler overview – Business Central | Microsoft Learn
Lastly, you can take a Performance Profile generated by the Performance Profiling features inside Business Central and open it in Visual Studio Code to have the same view and data review capabilities as a Visual Studio Code Snapshot profile. You can also open the Visual Studio Code Snapshot file in Business Central Performance Profiler.
This wraps up our three-post dive into performance capture and monitoring. I hope this help you improve the performance of your Business Central systems. Managing and improving the performance of a complex system can be very difficult, you now have three tools in your toolbox. Use them well!


Leave a comment