

BC AL Journey #27
In our BC AL Journey we have done a lot with data inside Business Central. We have covered data storage in tables and table extensions. We have accessed that data in Pages, APIs and most recently Queries. All of this bring us to one of the most critical, and challenging (at least for me) element of Business Central, Reporting.
I am separating reporting from Business Intelligence as reporting covers some very specific elements that Business Intelligence does not cover. Reporting is used for things like Sales Invoices, Purchase Orders, Checks, and other pixel perfect printed products. Reporting generates an “Artifact”, whereas Business Intelligence generates insights and analysis.
Reports and Queries have a lot in common with their data set structure. If you haven’t run through the BC AL Journey on Queries, I would recommend giving that a read first.
There are three reporting technologies available inside Business Central: Microsoft Excel, Microsoft Word, and RDLC (Report Definition Language Client). Initially Microsoft delivered all Business Central reports as RLDC reports, but as of the writing of this article they are in the process of migrating to Microsoft Word Reports. The great thing about Excel and Word reporting is that most people have the tools to modify the reports already installed on their computers. We will cover all three, starting with Excel Reporting.
Microsoft Excel Reports are the easiest for end users to modify, and one of the easiest data sets to create. Let’s get right to it. For this example, we are going to recreate the Customer Ledger query we created earlier but as an Excel report.
I’m going to create a file in the 9 – Report folder named ARDCustomerActivity.Report.AL
namespace BCJourney.BCJourney;

using Microsoft.Sales.Customer;
using Microsoft.Sales.Receivables;

report 50000 ARD_CustomerActivity
{
    ApplicationArea = All;
    Caption = 'Customer Activity';
    UsageCategory = ReportsAndAnalysis;
    DefaultLayout = Excel;
    ExcelLayout = 'Layouts\ARD_CustomerActivityLayout.xlsx';

    dataset
    {
        dataitem(Customer; Customer)
        {
            RequestFilterFields = "No.";
            column(No; "No.")
            {
            }
            column(Name; Name)
            {
            }
            dataitem(CustomerLedgerEntry; "Cust. Ledger Entry")
            {
                RequestFilterFields = "Posting Date";

                dataitemlink = "Customer No." = Field("No.");
                DataItemTableView = sorting("Customer No.", "Posting Date", "Currency Code")
                                      where("Document Type" = FILTER(Invoice | "Credit Memo"));

                column(SalesAmount; "Sales (LCY)")
                {
                }
                column(PostingDate; "Posting Date")
                {
                }
            }
        }
    }
    requestpage
    {
        layout
        {
            area(Content)
            {
                group(GroupName)
                {
                }
            }
        }
        actions
        {
            area(Processing)
            {
            }
        }
    }
}
Right away we can see a similarity in the general structure of a Report vs a Query. The query starts with an element which contains nested dataitems, a report has a dataset and nested dataitems. The dataitems have a dataitemlink value that connects them to their containing record.
The Query objects use a DataItemTableFilter to filter data at the dataitem level. The Report uses as DataItemTableView to do similar work. The main difference is that a DataItemTableView includes additional details such as Sorting as well as filters.
The last things we need to review before running the report is the use of RequestFilterFields. This is defined at the dataitem level and allows us to prompt the user for filter parameters at report runtime. In this example, we are allowing the user to filter by Customer No. and Customer Ledger Entry Posting Date.
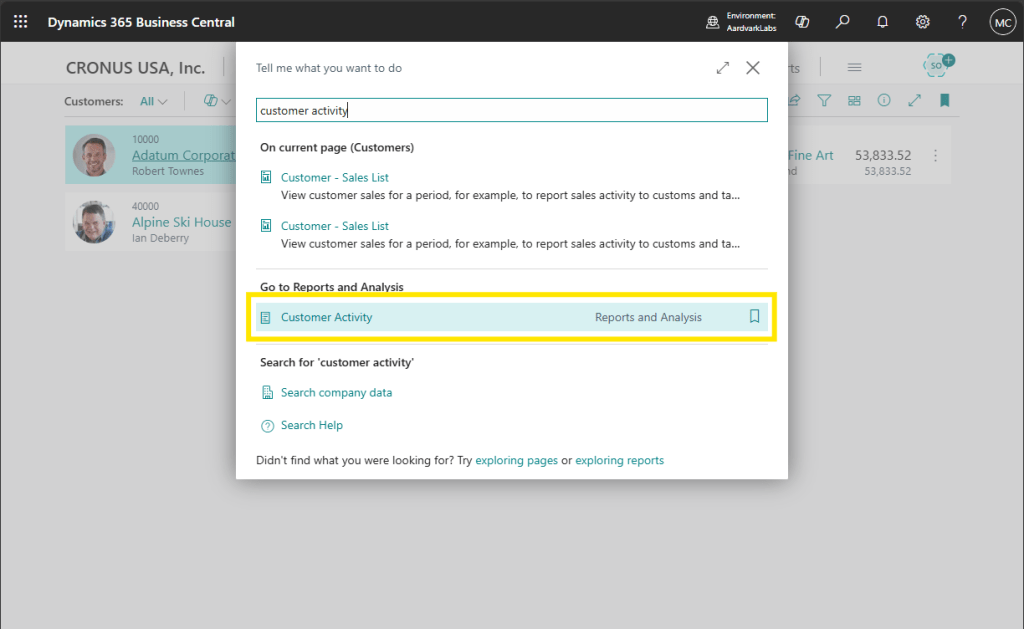
Let’s publish and run this report. We can find it by name with the “Tell me” magnifying glass. The name is defined by the report Caption.
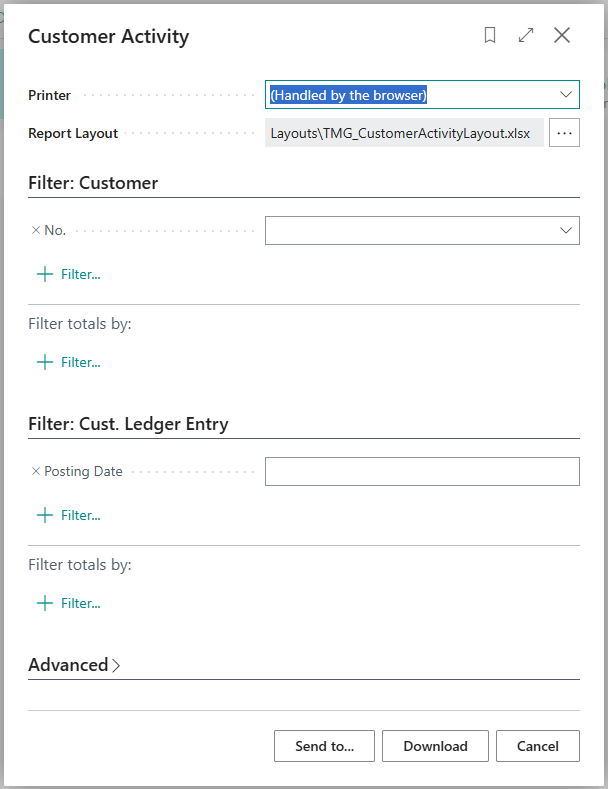
The report then prompts us for the filters we defined. You can see the Customer No. and the Customer Ledger Entry posting date filters we defined. We are also able to add additional filters in this dialog if we like.
When we click Download, our browser downloads a Customer Activity.xlsx file. When we open that file, we see an Excel document with a few tabs, and in the Data tab, our results.
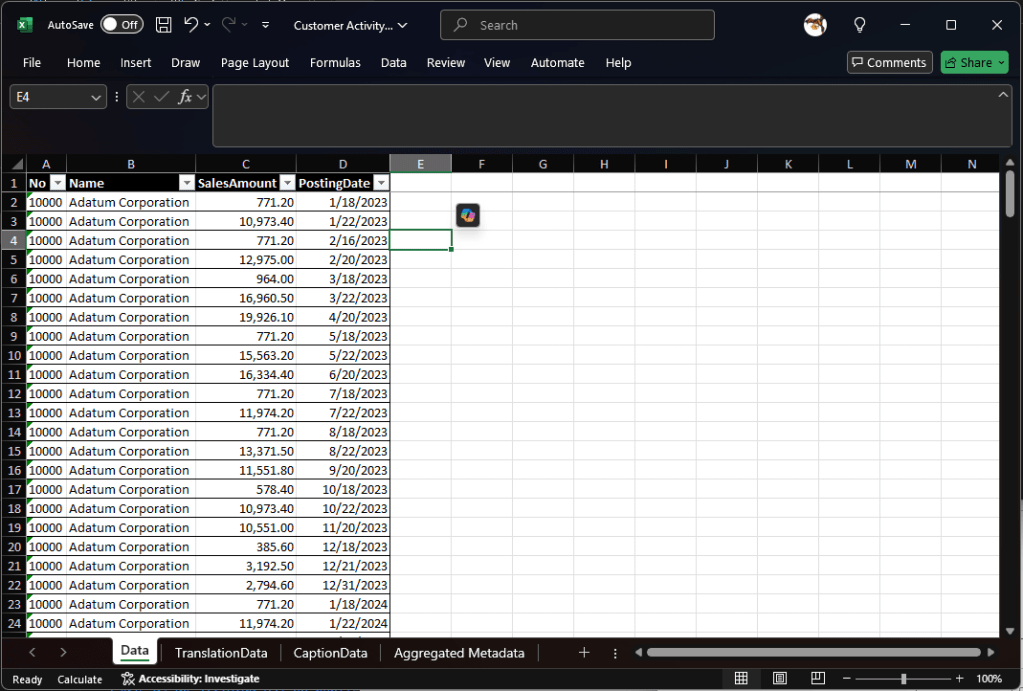
The other tabs contain metadata about the report but aren’t important to what we are looking to accomplish today. The only tab we are interested in right now is the Data tab.
This report is fine, but a little dull and useless. If we want to customize this report, we can add tabs to it.
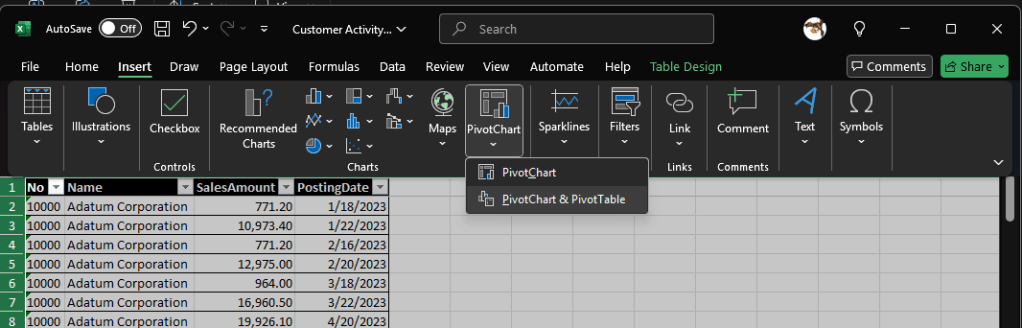
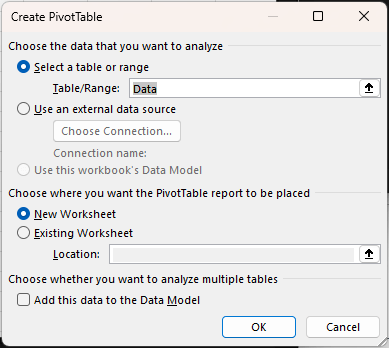
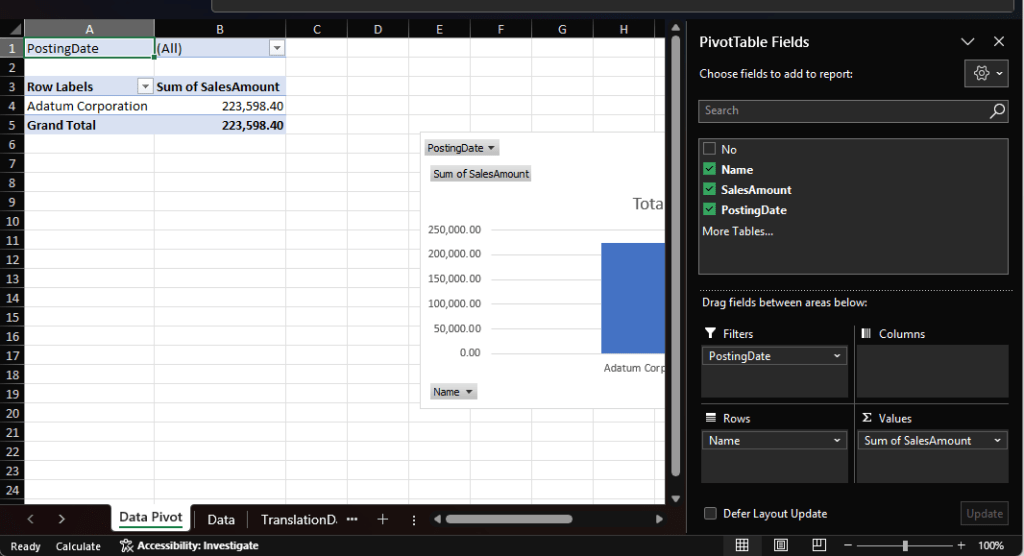
Let’s create a pivot table and chart. While on the Data Tab I’m going to click Insert, Pivot Chart and select Pivot Chart & Pivot Table.
I’m going to verify that it is taking the Data table as the source and I’m going to create a new worksheet.
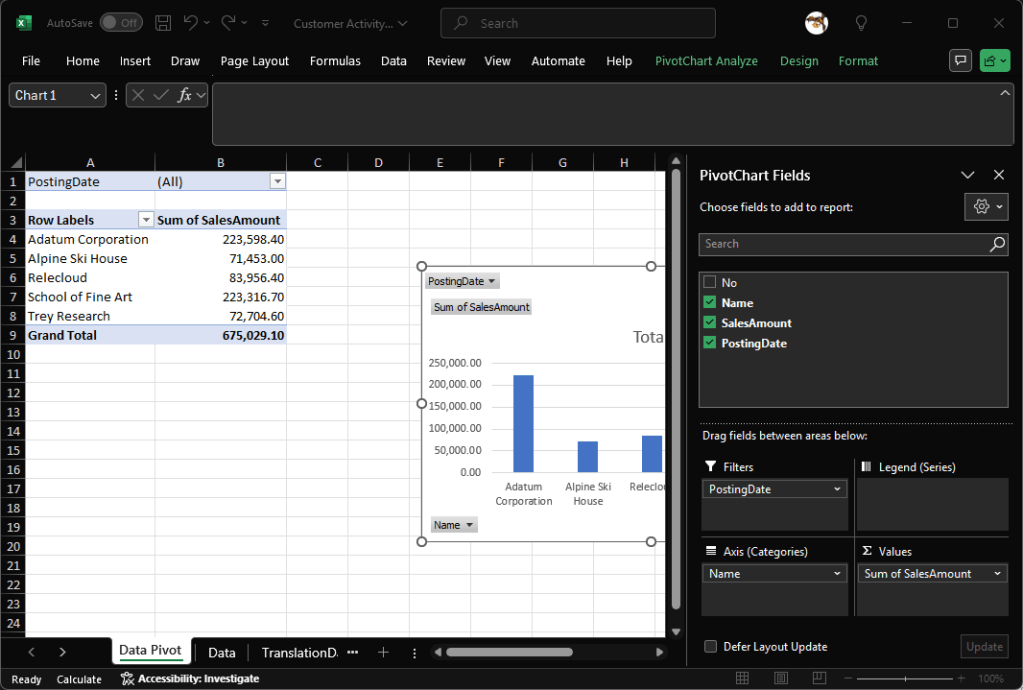
On the new sheet, which I renamed Data Pivot, I’m going to create my pivots.
This works great, but I don’t want to have to recreate my Data Pivot tab every time I generate this report. The superpower of the Excel report is that we can simply upload this report back into Business Central as the new layout, and next time we run this report we will have our Data Pivot tab already created!
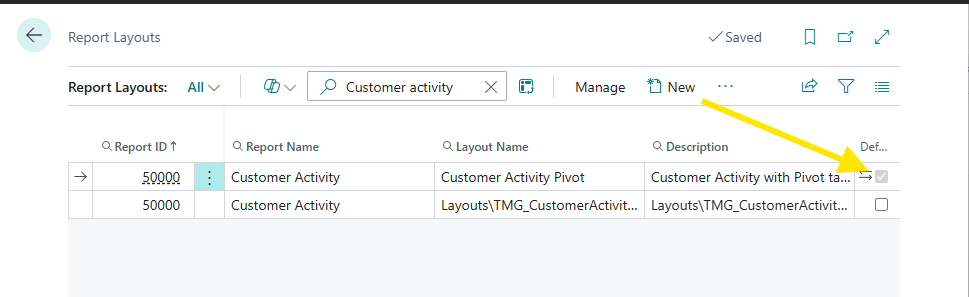
In Business Central, use the Tell Me magnifier to open the Report Layouts page.

Filter the page to show the Customer Activity report.
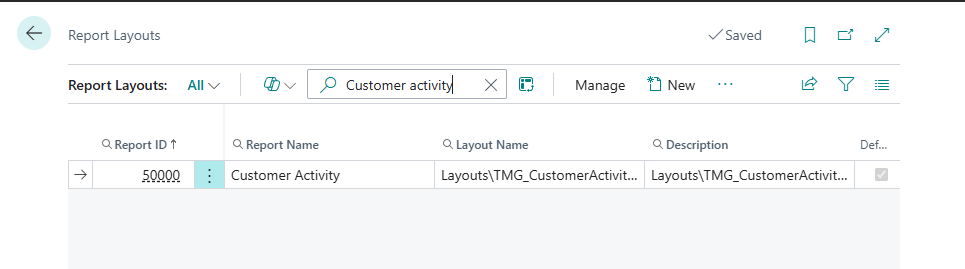
Click the “New” button in the menu. Then fill out the details of the new report layout.
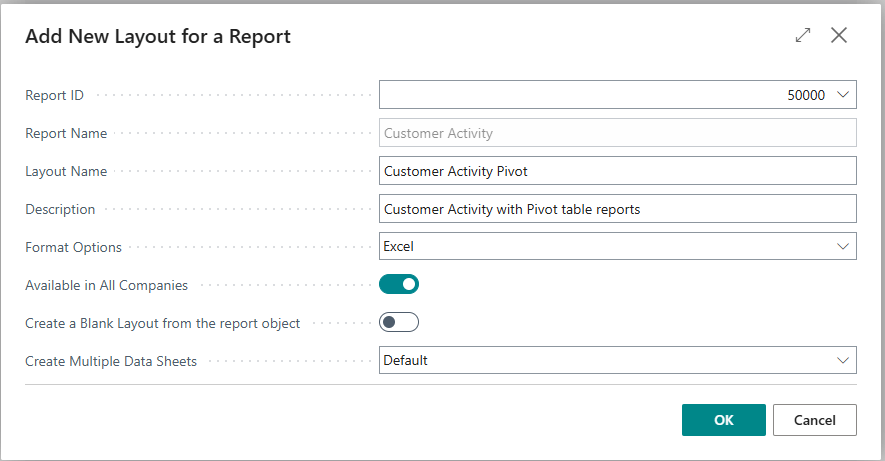
When you click Ok, you will be prompted to upload a file.
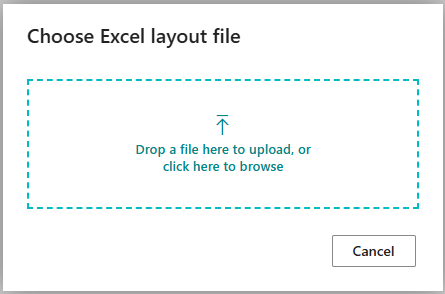
We can drag and drop our Excel file with the Pivot Data tab here. Once uploaded you will be returned to the Report Layout list, with the new layout available. Click the Default check box next to the new layout to make this our default.
When I run the report again, but this time filter to just company 1000, when I download the Excel report it looks like this.
Business Central updated the 4 original tabs, including the Data tab, and left the Data Pivot tab we created alone. Because the Data Pivot tab referenced the Data tab our pivots are all automatically updated.
This is how you can create a rather complex data set and provide it to your Excel Power Users to perform the calculations and reporting they require. The completed report can then be uploaded to Business Central and anyone with access to the Business Central report can have an up-to-date version at any time.
There is a lot more to explore in the world of Business Central reports. We will introduce those features and functions as we explore Microsoft Word and RDLC reporting in our Business Central AL Journey. Thanks for joining me!
As always, the entire solution is available in the AardvarkMan GitHub.


Leave a reply to Step-by-Step Guide to Word Reports in Business Central – Aardvark Labs Cancel reply