

BC AL Journey #30
In our exploration of reporting technologies in Business Central we have covered Excel and Word (Part 1 and Part 2) reports. The final reporting technology we are going to explore is the RDLC report.
RDLC stands for Report Definition Language Client, which is an extension on the original RLD, Report Definition Language, which dates back to the SQL Server Reporting Services systems. The main difference between the RDL and RLDC systems is that the RDLC is capable of self-hosting the report and can contain the data, where the RDL simply defines the report and must be hosted.
Unlike the Word and Excel reports, this is going to require software not typically included in your common desktop. We will need to install the Microsoft Report Builder.
After downloading the software and starting the installation, we may recognize a logo.
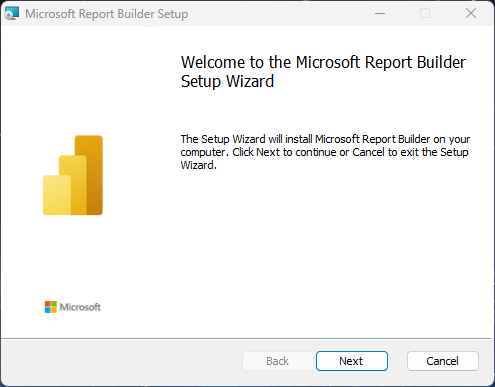
That is the logo of the Power BI Team. RDLC Reports are also used for paginated reports in Fabric and the technology supporting that is now part of the Power BI family of products. There are no options in the install except for installation location, so I’m going to assume you can click “next” and “finish” without additional screenshots.
Let’s start by editing an existing report, the Customer List report (number 101) is a nice simple report. In Business Central, go to “Report Layouts”, find “Customer List” and Export the Layout.
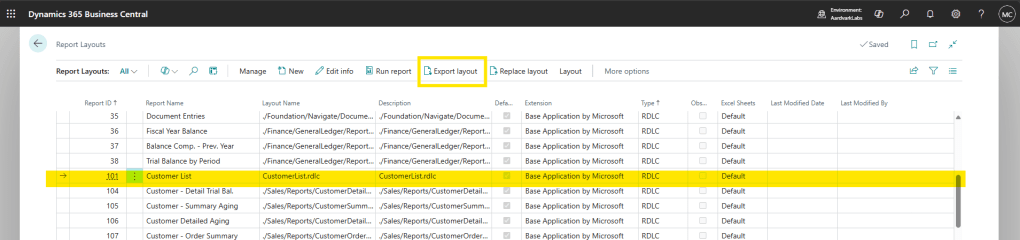
This will trigger a download of “CustomerList.rdlc”. Open that with Microsoft Report Designer. Here is where we hit our first challenge, Microsoft Report Builder only recognizes RDL files. You will either have to rename the file to end in .RDL or put the entire file path into the name field of the open dialog box.
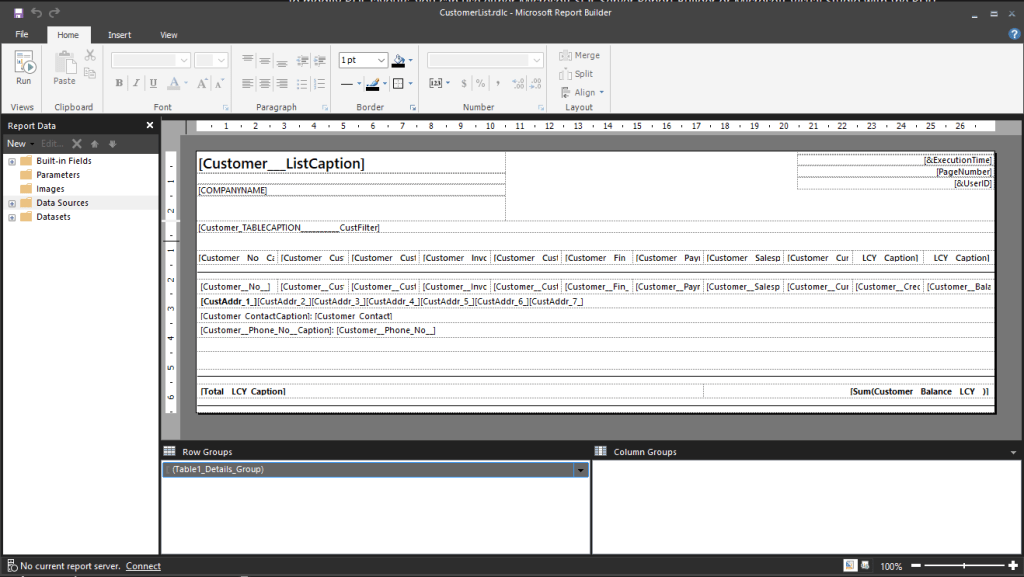
Once opened, you should see something like this:
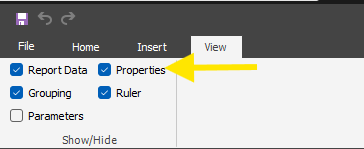
On a new installation, it is helpful to display the Properties dialog. Click on the View tab and select the Properties checkbox.
Let’s compare the report output from Business Central with the Report Design in Microsoft Report Builder.
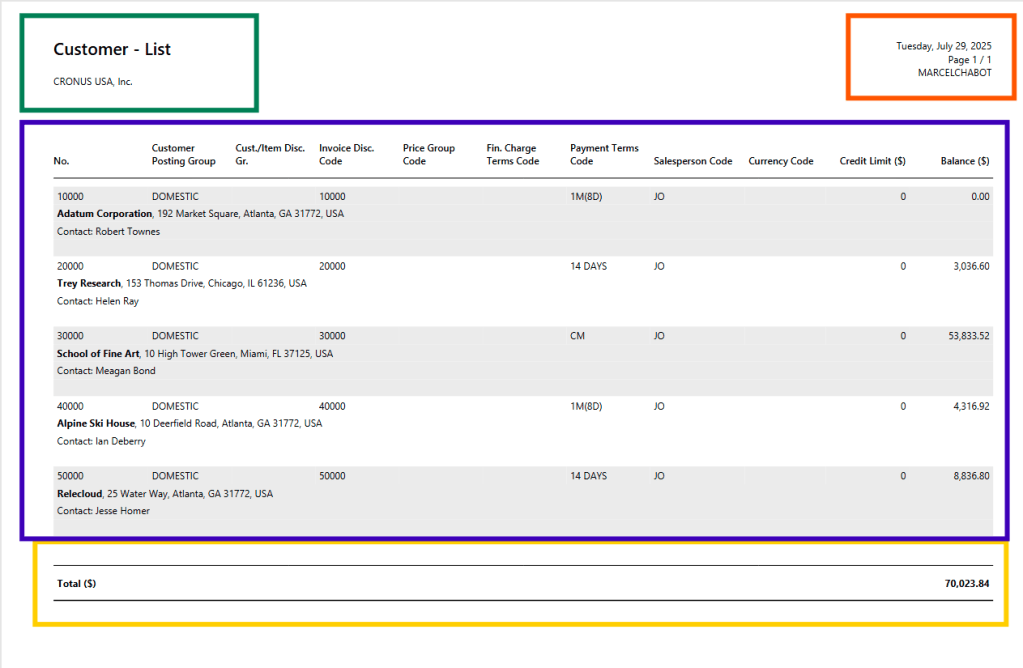
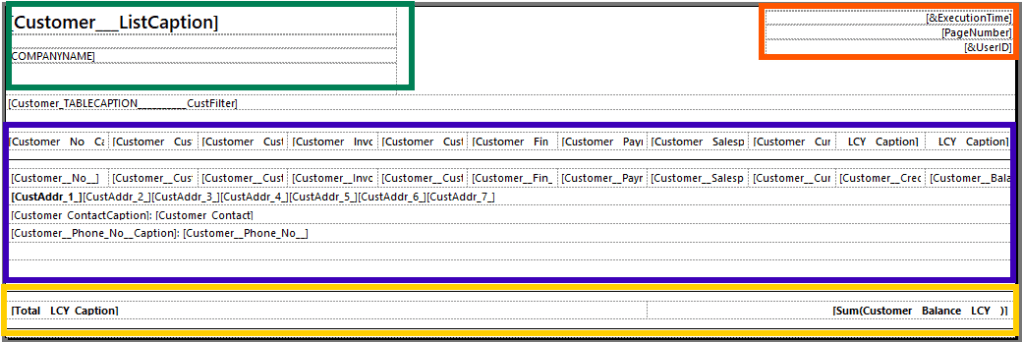
We can see that the green, orange, and yellow boxes are text boxes, the blue box contains a table of data. The really powerful thing about these reports is unlike a Word report, which is a document and therefore the layout is flow based, elements in an RDLC report are placed based on exact positions and are allowed to grow or shrink. This allows for easy implementation of a Pixel Perfect Printed Product.
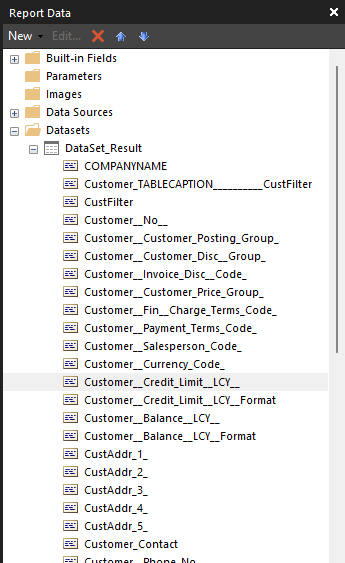
Where do these data elements come from, on the left side of the Report Builder we can find the “Datasets” folder and DataSet_Result set.
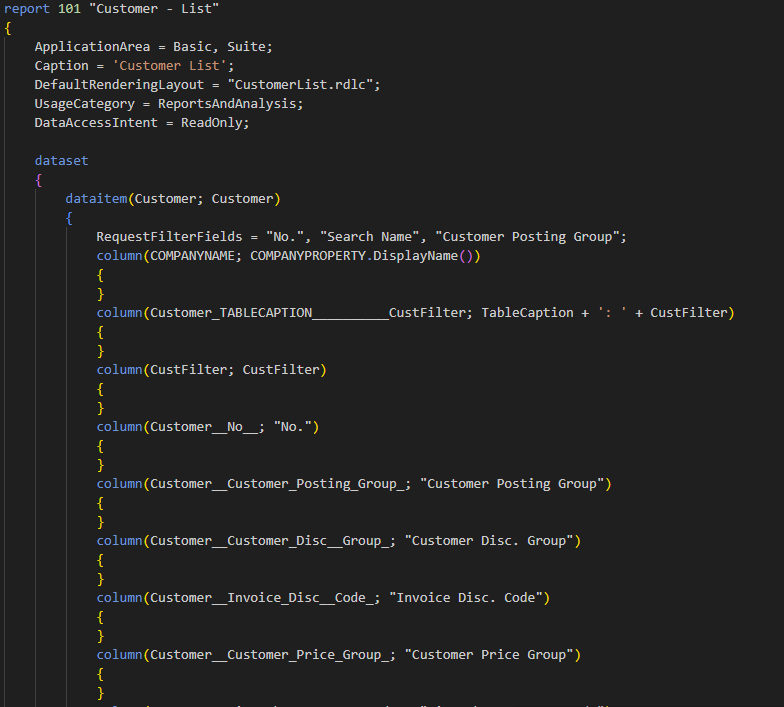
If we take a look at the Report AL code, we can see where these fields come from.
If we take a look at the Company Name in the green box, we can see how the fields are managed.
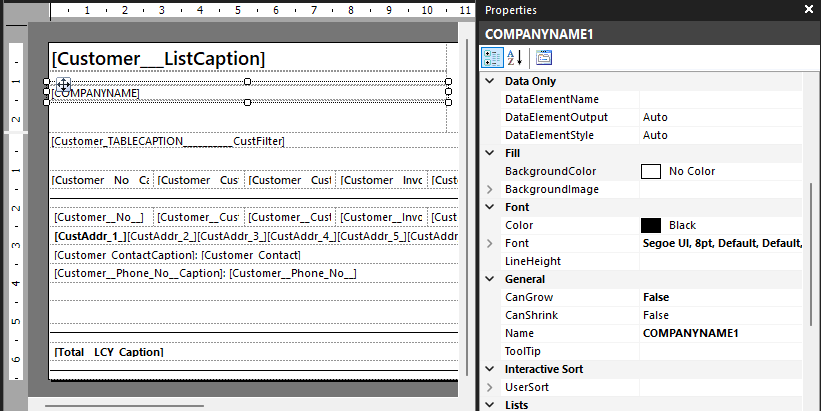
Company name is a Text Box element, and we can see all the properties in the properties dialog which we activated earlier. We can set the text color, font, placement location and all sorts of properties. Almost any property can be replaced by an expression, allowing things like element visibility, color, font size, to be managed by data within the report.
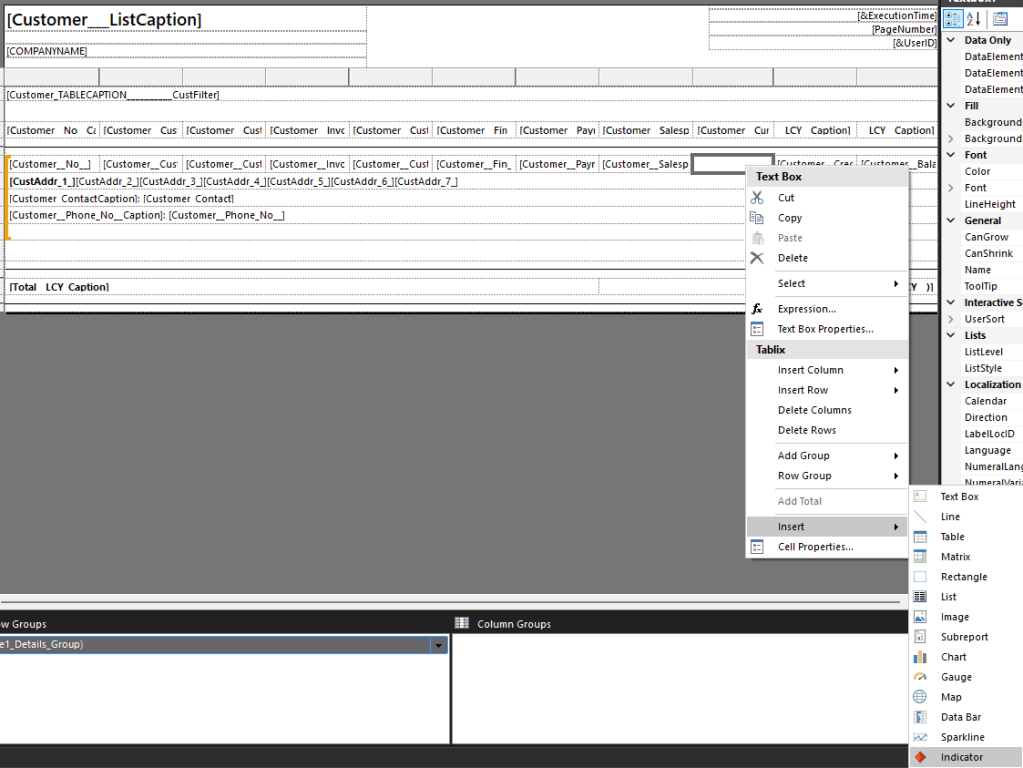
We can Right Click on a Text Box element to get it’s text expression.
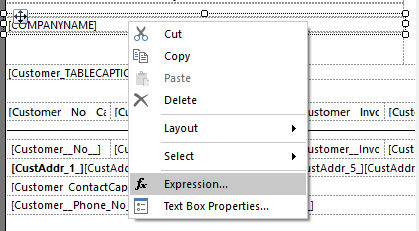
Here we can see that the content points to a field called CompanyName and its value.
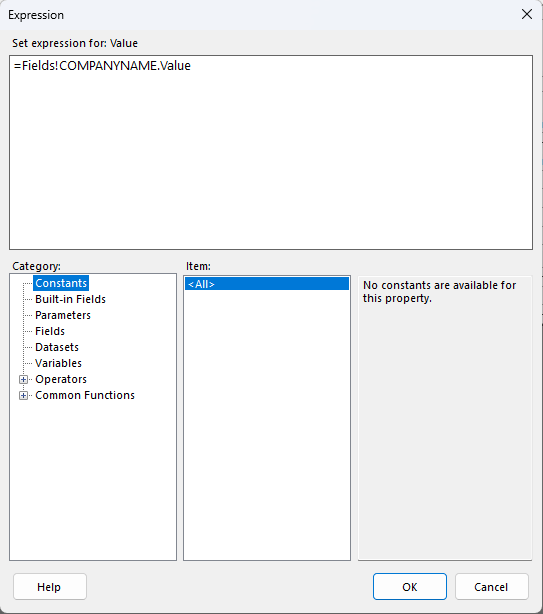
We can include some rather complex expressions here. We can concatenate text, we can perform Boolean operations to select text, we can do math.
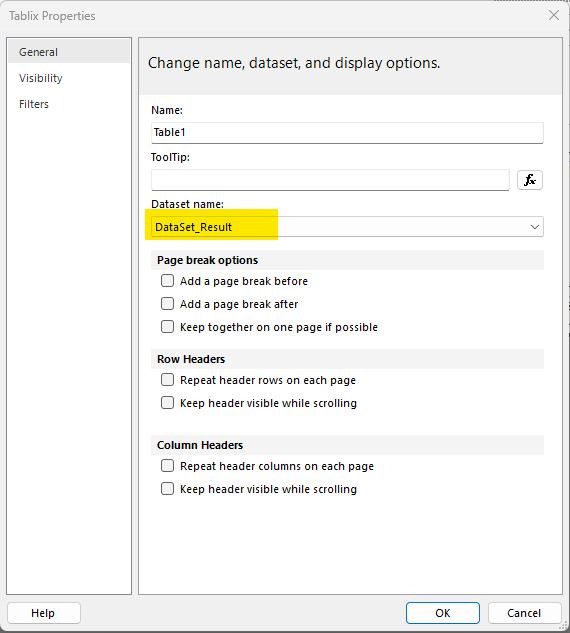
The next part of the report the part I boxed in blue is a Tablix. Is it a table? Is it a Matrix? No! It’s a Tablix. I get accused of making up words all the time, but I’m not taking credit for this one.
A Tablix works best when connected to a data set, and in the Tablix properties we can see that it is indeed connected to DataSet_Result.
A Tablix allows you to define rows, columns, row groups and column groups, which is how it pulls off the table/matrix look.
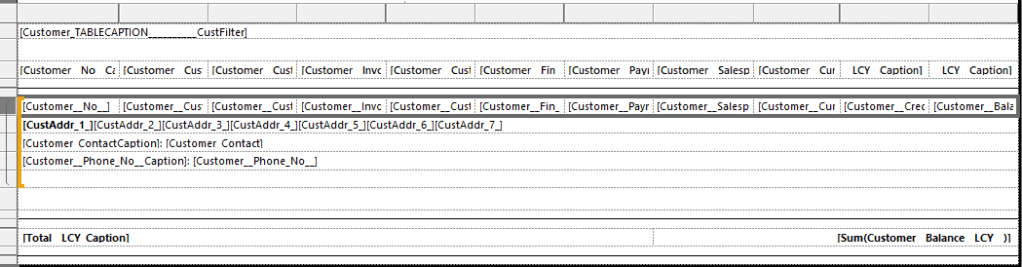
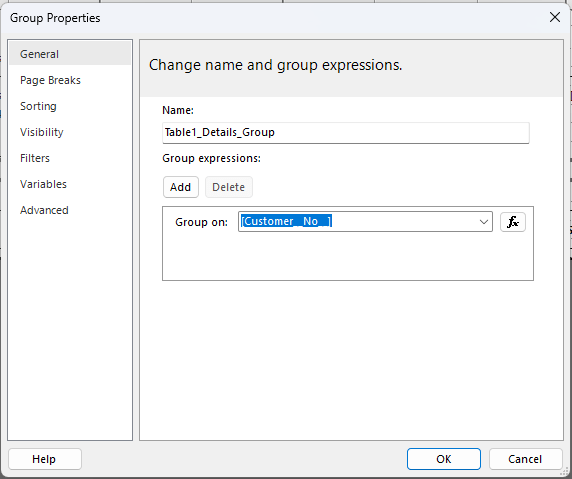
The orange indicator on the left denotes that the column here are part of a row group. This specific row group is grouped by Customer No.
The cells of the table are filled with any of the data elements, but most commonly a Text Box.
Looking at the Text Box that makes up Customer Address Line 2, we can see how an expression can be used to create a text output.
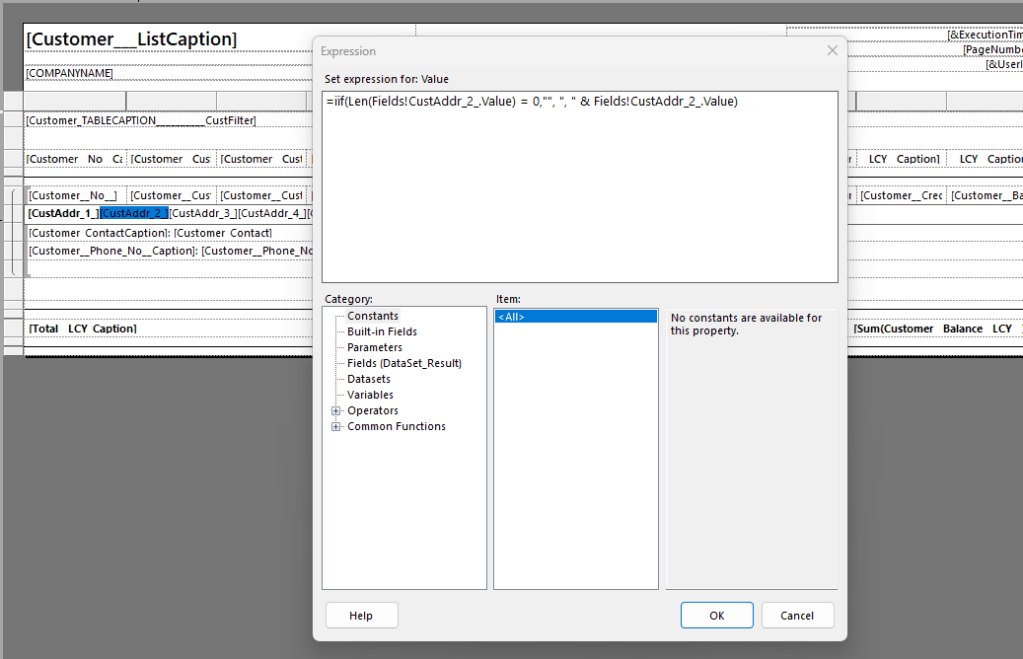
What this reads is: If the length of the CustAddr_2 Value is zero, put an empty string here, else insert a comma and the value of CustAdd_2. This allows it to build out a presentable address one element at a time.
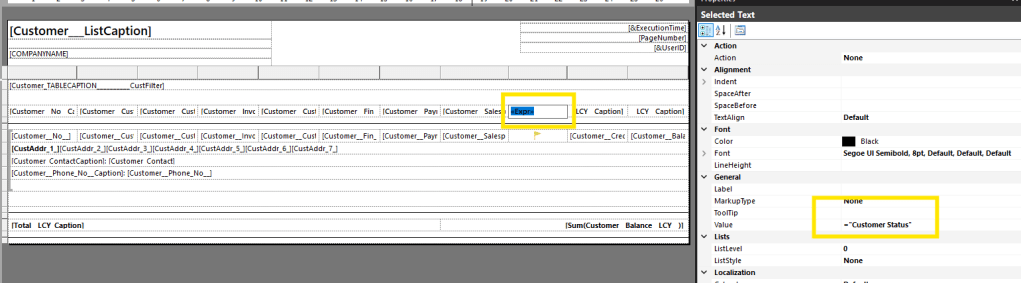
For this report, let’s replace currency with an indicator. First I’ll delete what is in the currency field, then right click and insert an indicator.
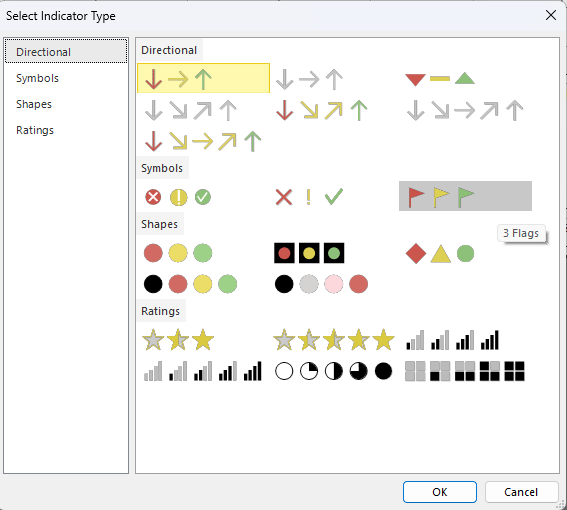
I then have to select which kind of indicator, and I’m going with flags.
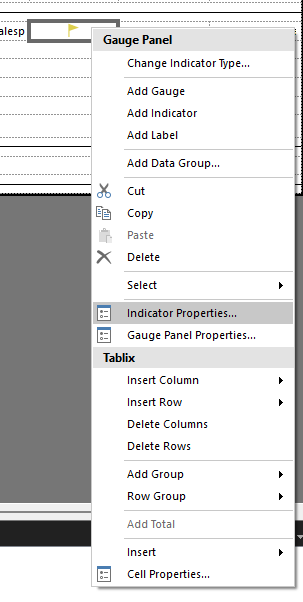
I’ll then right click on the indicator and select indicator properties.
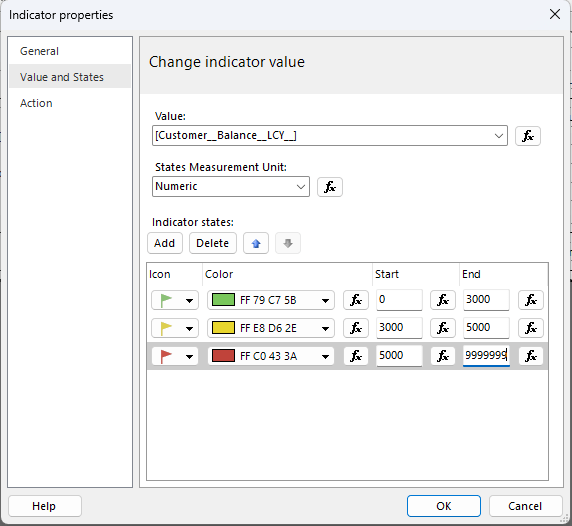
Then I’m going to select Value and States and configure it like this:
Click OK.
Carefully select the Cell and let’s change the background color to an expression.
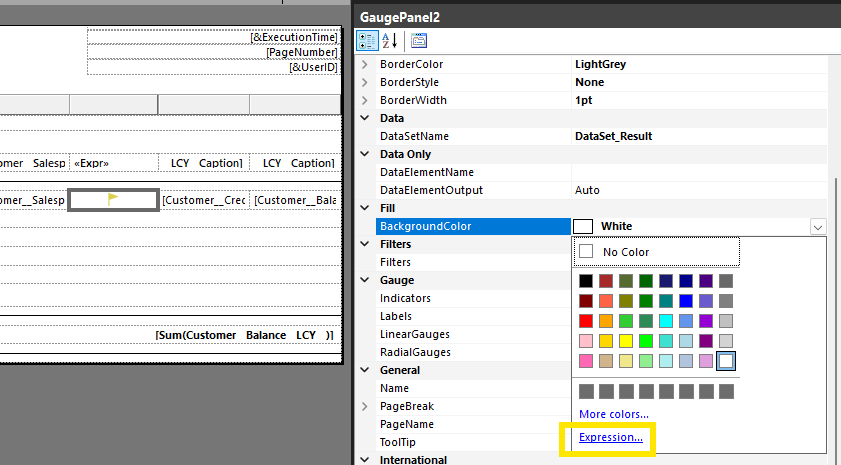
=iif(Code.GetRowColor() = TRUE, “#EBEBEB”, “White”)
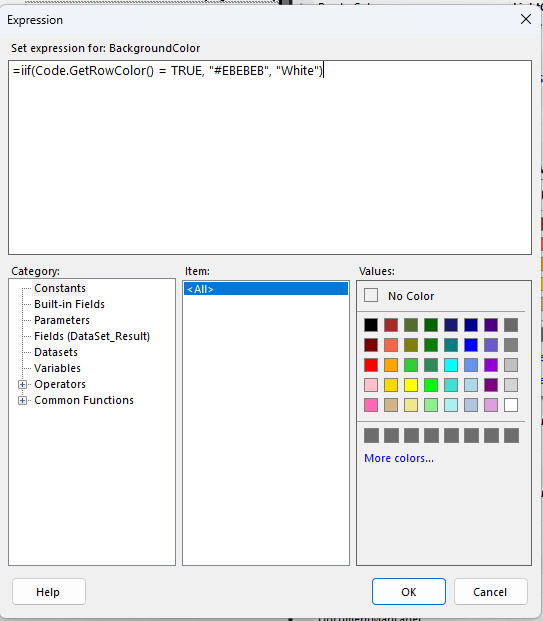
This generates that alternating gray / white background color effect.
Lastly let’s change the column title by setting the value to “Customer Status”
Save the report, and let’s go back to Business Central Report Layouts.
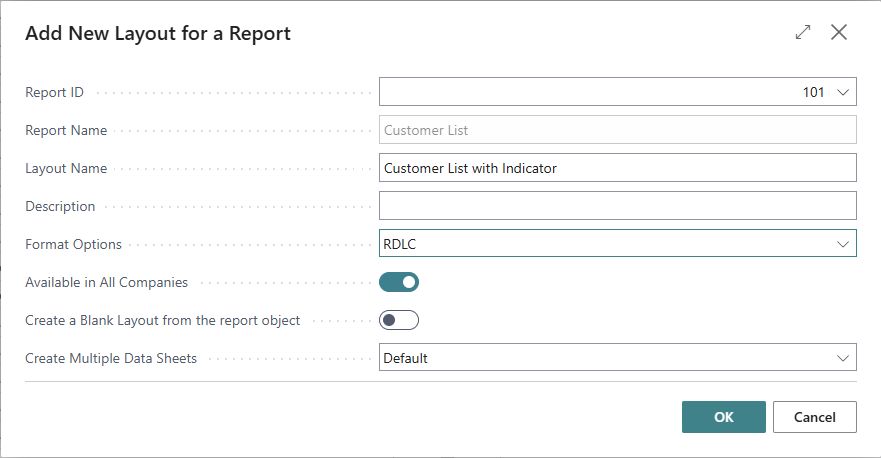
With the Customer List Report Selected, click the New Button, then fill out the form. Be sure to select RDLC as the report format.
When you click OK you will be prompted to upload your new report layout.
When I run my new report here is the output I get:
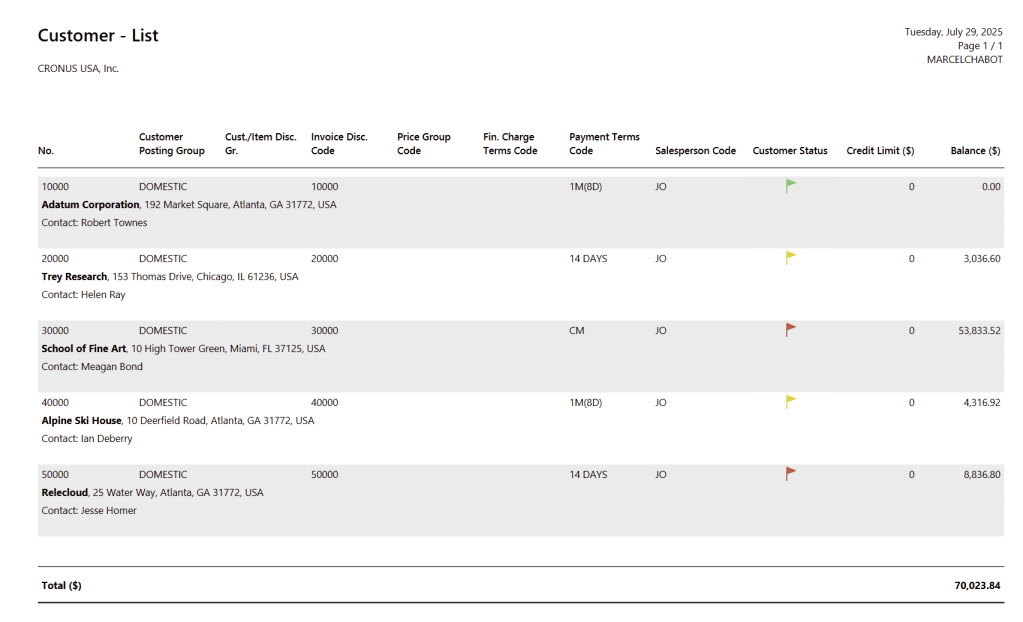
As you can see there are a lot of capabilities in the RDLC report system, and we have only scratched the surface. The ability to efficiently utilize expressions for almost any property as well as data values makes these reports very versatile. They also require additional software and a specialized skill set.
We now have a basic understanding of the three reporting systems inside Business Central. So, which one do we use? Here is a breakdown:
Excel Reports: We want to work in Excel, with Excel tables, Excel graphs, Excel pivot tables. We intend to do report data processing inside Excel.
Word Report: We have a document style layout without too much data driven complexity. All the data calculations are performed in AL and delivered to the report completed and ready for layout. Words “squishy” layout and pagination controls are good enough.
RDLC Report: We have complex calculations and layout events that must be handled within the report rending process. We are VERY specific on the layout down to the in, mm, cm, or pt. I was sad when they dropped the twip as a unit of measure.
More information available here Working with RDLC Layouts – Business Central | Microsoft Learn.
I hope you enjoyed learning about RDLC reports. Let me know if you have any questions and thank you for joining me on our 30th step on our AL Journey.


Leave a comment