

BC AL Journey #28
Last time on the BC AL Journey we created an Excel report. We started from scratch, created a report object, and then created the layouts. Now we are moving into Word Reports. These are a little more complex and as opposed to starting from scratch on our first report, let’s start by modifying an existing report. This will give us an opportunity to learn the lay of the land before we get too involved.
We are going to stay away from any code development and focus on the mechanics of Word Report layouts. Let’s take a look at the Sales Quote report (Number 1304).
In Business Central, use the Tell Me magnifying glass to open “Report Layouts” and find the Standard Sales Quote (Word), report.

With the report selected, click the “Export Layout” button. This should trigger a download of a Word document. Go ahead and open that document in Microsoft Word.
If Word isn’t displaying a Developer tab like this:
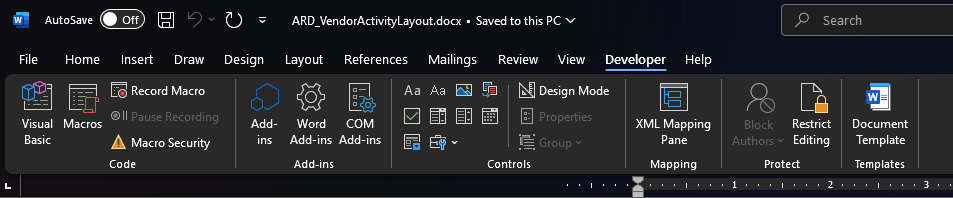
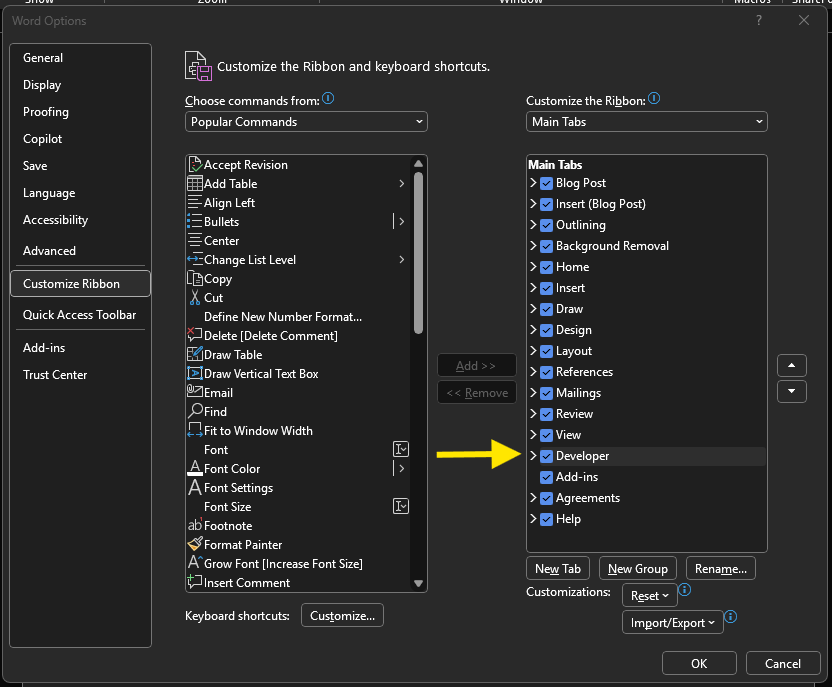
Then you need to enable the Developer Ribbon by clicking on File then Options. Once there, select the Customize Ribbon option on the Left and activate the Developer tab.
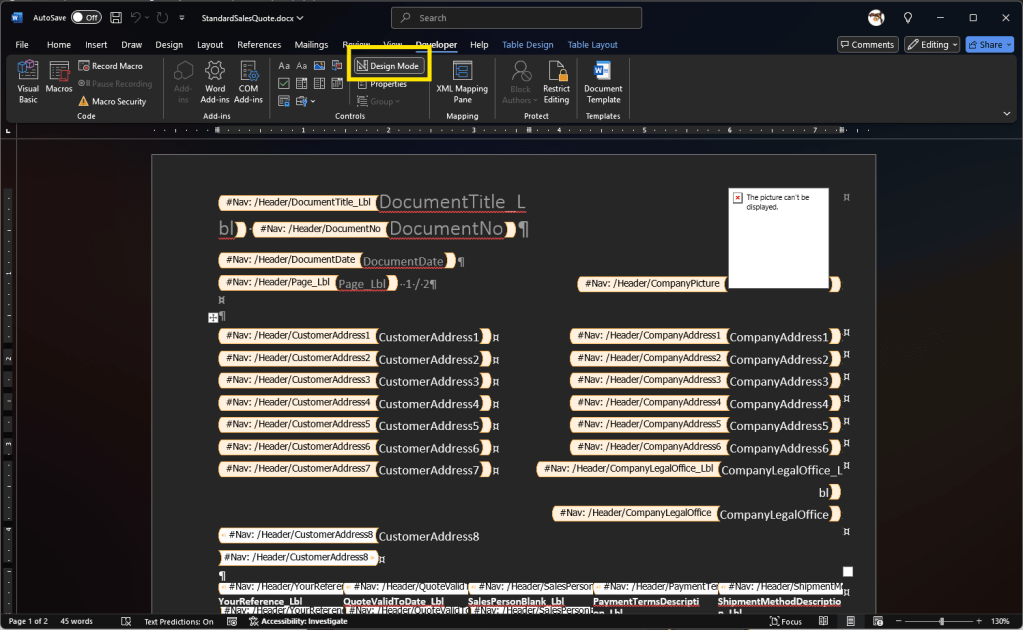
With the Word document loaded, in the Developer tab, click the “Design Mode” button. Everything should look like this:
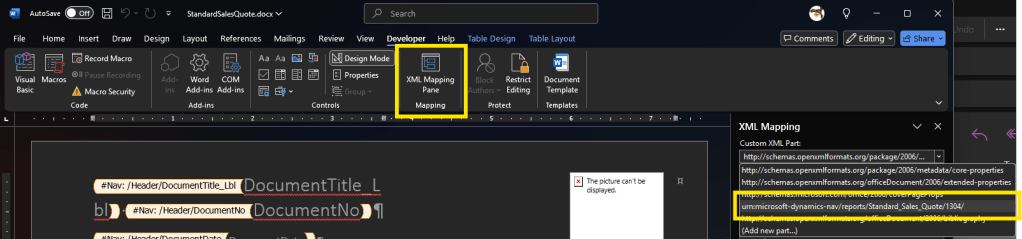
To see more details about the data sources we can click the XML Mapping Pane, and select the XML Part that shows urn:Microsoft-Dynamics-nav/Reports/Standard_Sales_Quote/1304/
Taking a deeper look at the XML Mapping, we can expand out the sections. BC Reporting Information contains details about the report and the request that generated the report.
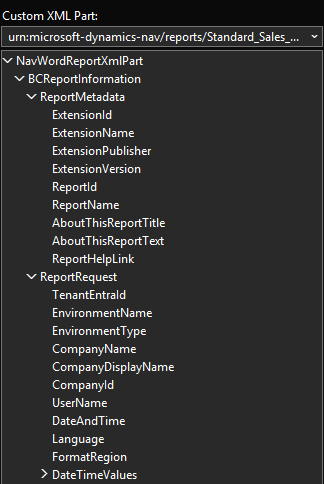
We can see details like which user generated the report, the Company, and the Business Central environment. The report metadata also include details about which extension the report originates from and the publisher of that extension.
For the Sales Quote, the data focused components are all enclosed in the Header section. If we do a bit of a side-by-side comparison of the Report AL code and the XML data tree we can see the matching data items and their corresponding XML Nodes.
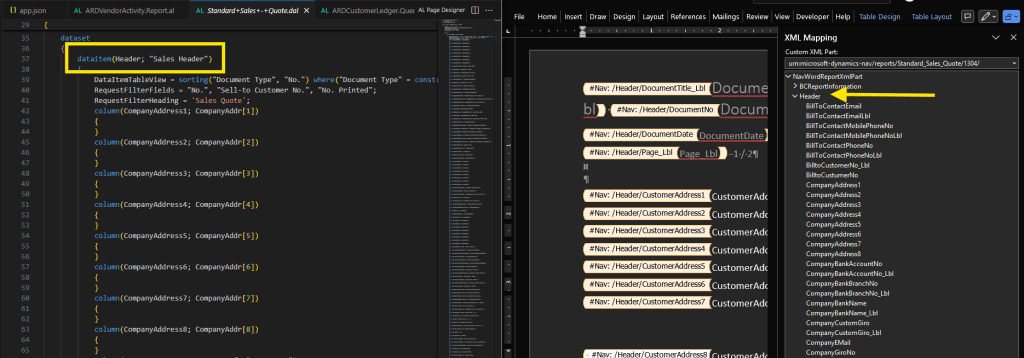
The field in Word are sorted in alphabetical order, but they all match the column names in the Report AL code.
We can see the sales line data as well.

Each data item in the report is an XML Node in the XML Mapping pane. Each column in the AL is an XML Value.
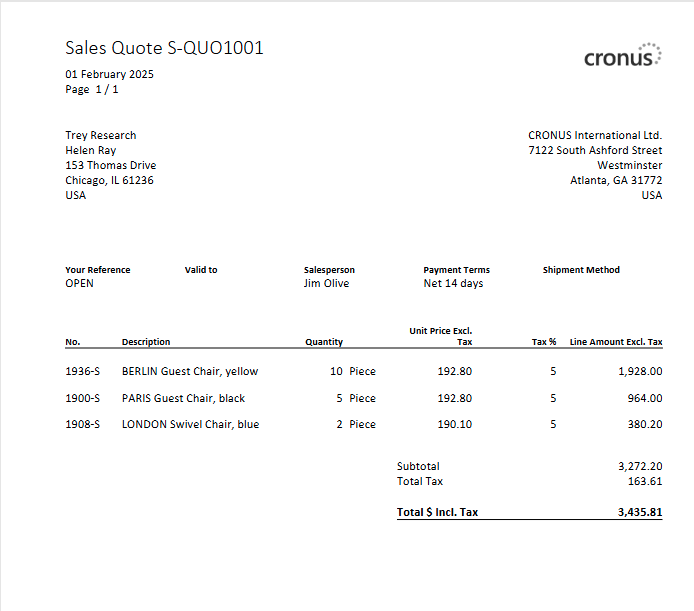
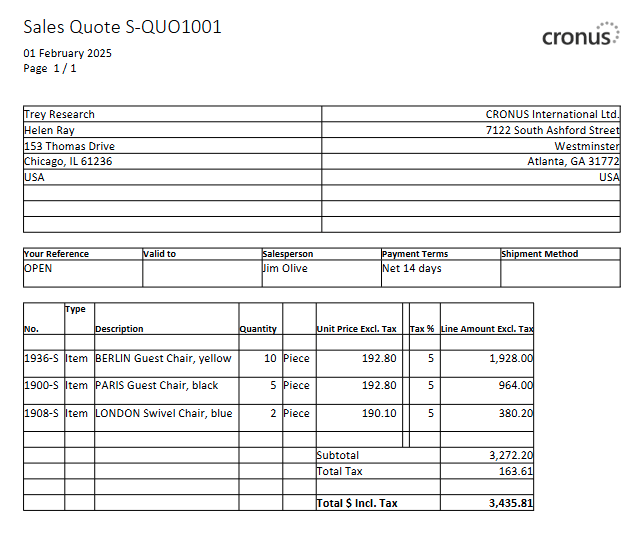
If I print this document it looks something like this:
Back to our Microsoft Word editor. The key element to a successful report layout is the use of tables. Tables manage repeating elements, keep things aligned, and help the report flow. The design view can get really jumbled, and without tables and grids it is difficult to get the layout correct.
If I edit the report and turn on grid lines, we can see the layout of the data elements is driven by the placement of grids. I turned off “Design Mode” to make the grids a little more visible.
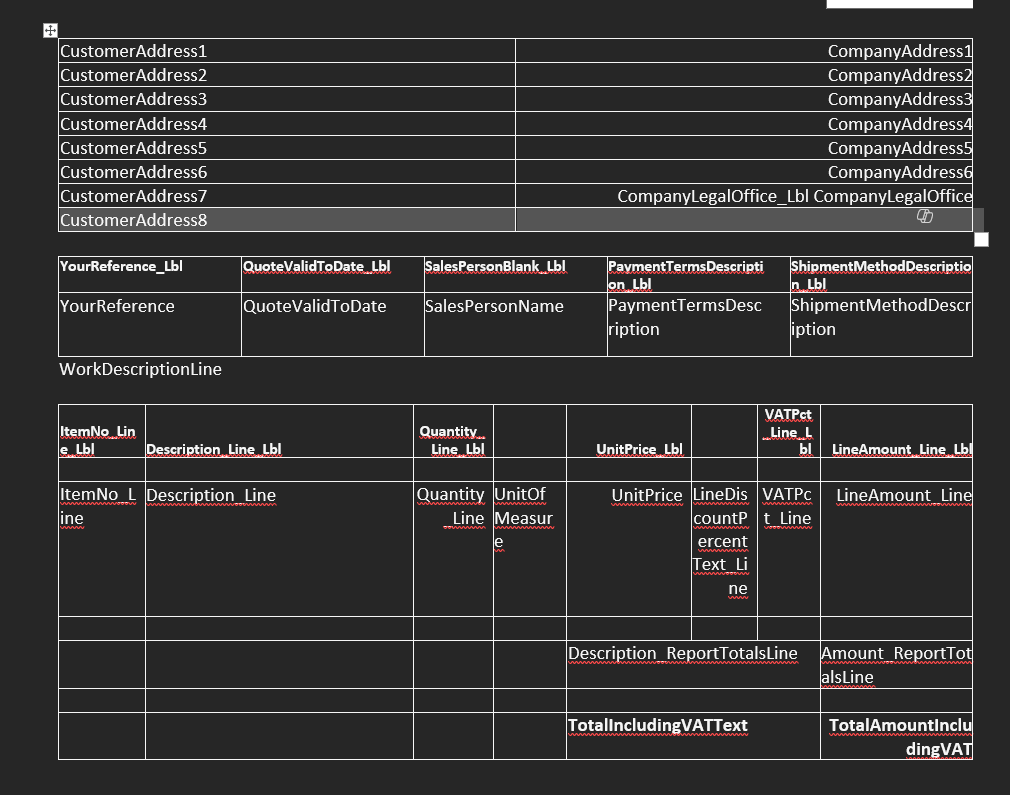
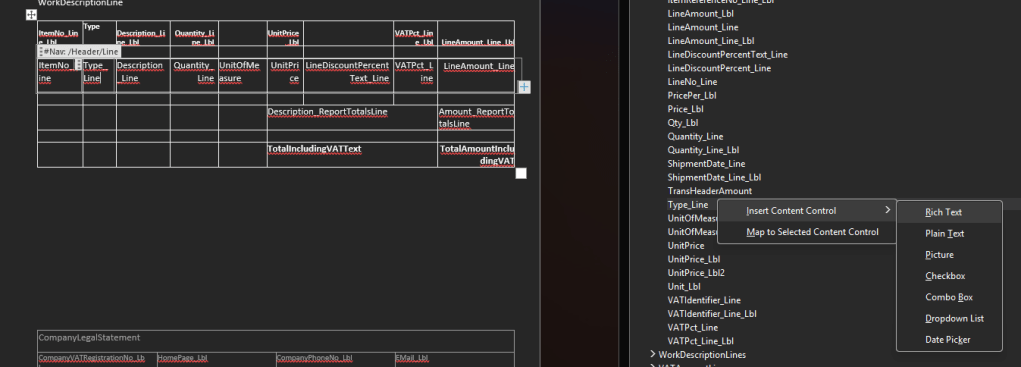
If we wanted to add the Line Type to the item grid, we could add a column to the line grid.
After adding a title, select where you want to place the value, right click on the field in the XML Mapping and select Insert Content Control, and Rich Text.
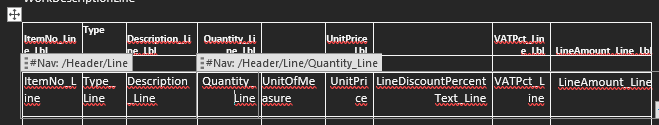
We can see the data value is added into the grid.
Looking at the values that were placed there by the Microsoft Developer you can see additional meta data added to each line. If you click on the Quantity_Line value, we can see the “#Nav:/Header/Line/Quantity_Line” description.
This was added by the report designer. You can manage these values by going to the Developer tab and selecting Properties.

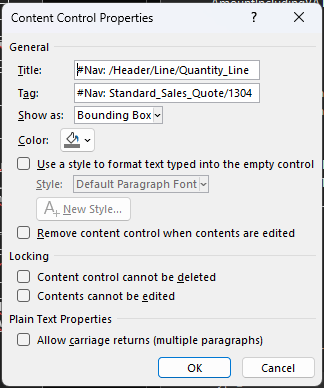
The Title and the Tag help document the field. It is a best practice to populate the title and tag with the nature of the data. The current reports display the path to the data element.
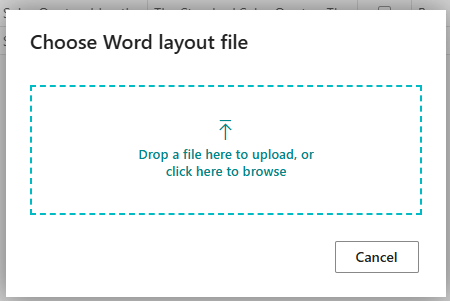
Back in Business Central we need to upload our changed report. In Report Layouts select the 1304 report we originally downloaded and then click “New”.

Fill out the form:
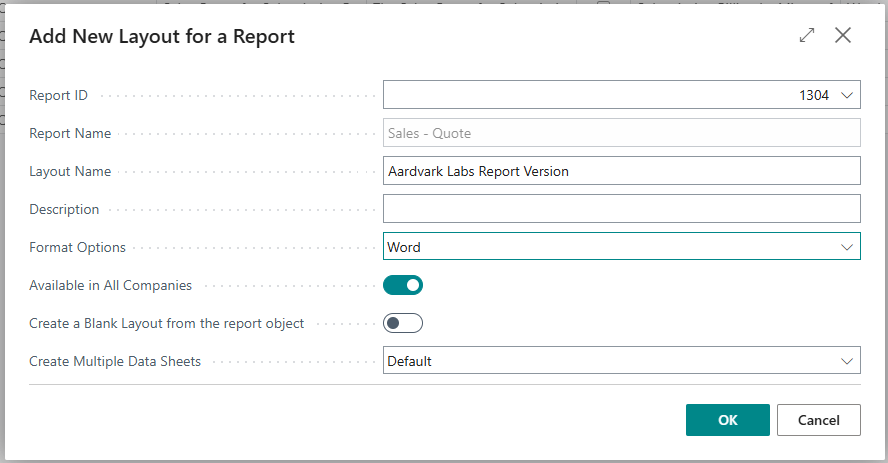
Click OK, then upload our edited file.
Our new report is now in the list.

When we run this report we can see the Type in the item grid, and how I’ve miss aligned the grid. We can also see all the grid lines I turned on to demonstrate the layout components.
If this report is what we want to use all the time, we can set the Default checkbox for that report layout.
Reporting isn’t my strongest skill. One of the benefits of being the Practice Manager is that I can delegate things I’m not good at. In the words of Mel Brooks:

Because of that, I tend the break the reports in very creative ways. You can’t test the reports in Word; they must be uploaded to Business Central. Don’t overwrite a perfectly good working report with an untested version. You can create as many report layouts as you want. Also save and version your Word documents, you may want to go backwards at some point.
That is the basics of Word Report Layout editing. With this knowledge, you can update the reports to match the fonts, color schemes, and layouts you need. Let me know in the comments if you have any questions or share Word Report layout challenges you have encountered.
There are a lot more details out there, the Microsoft Learn on Word reports is quite exhaustive.


Leave a reply to Step-by-Step Guide to Word Reports in Business Central – Aardvark Labs Cancel reply